0.008 0.20 0.34 0.70 1.73 1.20 4.91 1.70 10.65 2.20 19.68 2.70
0.016 0.25 0.42 0.75 1.95 1.25 5.36 1.75 11.39 2.25 20.80 2.75
0.027 0.30 0.51 0.80 2.20 1.30 5.83 1.80 12.17 2.30 21.95 2.80
0.043 0.35 0.61 0.85 2.46 1.35 6.33 1.85 12.98 2.35 23.15 2.85
0.064 0.40 0.73 0.90 2.74 1.40 6.86 1.90 13.82 2.40 24.39 2.90
0.091 0.45 0.86 0.95 3.05 1.45 7.41 1.95 14.71 2.45 25.67 2.95
0.125 0.50 1.00 1.00 3.38 1.50 8.00 2.00 15.63 2.50 27.0 3.00
0.166 0.55 1.16 1.05 3.72 1.55 8.62 2.05 16.58 2.55 28.37 3.05
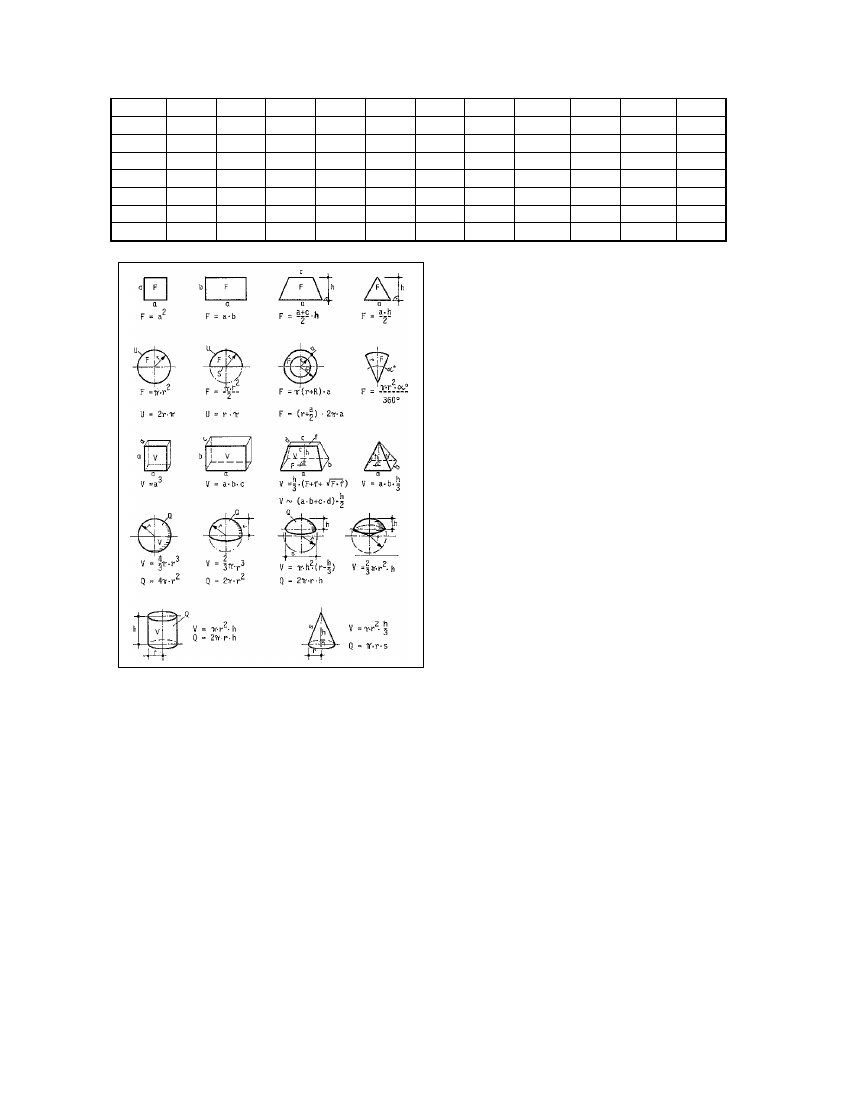
Fig. 10.11: Fundamental geometric formulae
(Source: Sasse 1984)
10.4 Charts and tables for use in performing micro-economic
Notes on using the data sheet (table 10.10)
The data survey (data sheet, table 10.10) contains fictive, but nonetheless substantially realistic,
data on a family-size biogas plant. Those data are reffered to for explaining and calculating the
arithmetic models described in chapter 8. Such data must be ascertained separately for each
project site.
Notes on the individual data-sheet items
1. In order to keep the calculations uncomplicated, an unrealistically constant annual rate of inflation
is assumed. It is possible to account for different inflation rates in the various analytical procedures.
For explanatory details beyond those offered in this guide, please refer to Finck/Oelert, chapter C
III.
122