
In statistics, a population includes all members of a defined group that we are studying for data driven decisions.

A sample is a set of data collected and/or selected from a population by a defined procedure.

A random sample, also called a probability sample, is taken when each individual has an equal probability of being chosen for the sample.

Random assignment helps eliminate the differences between the experimental group and the control group.
Surveys and experiments are both statistical techniques used to gather data, but they are used in different types of studies.
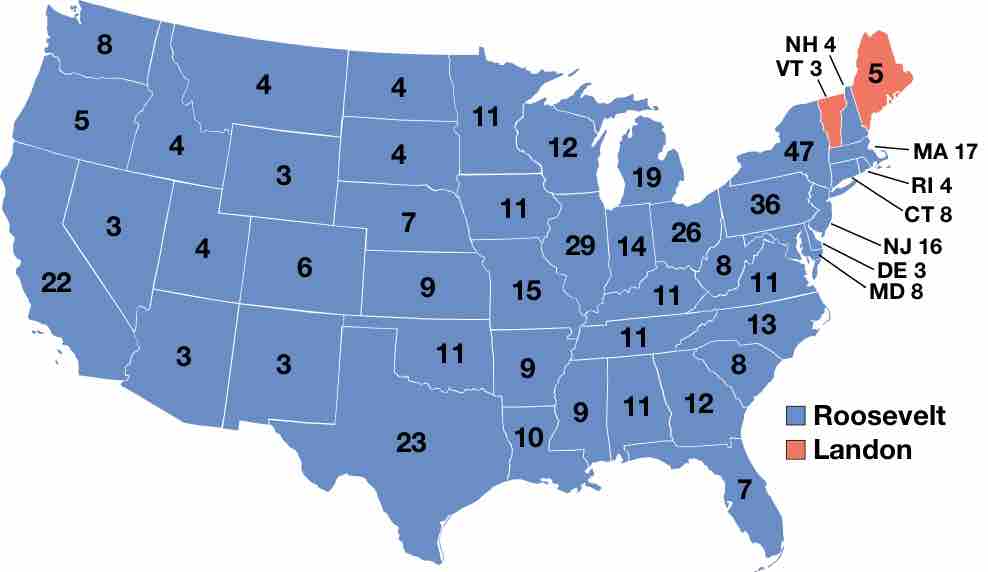
Incorrect polling techniques used during the 1936 presidential election led to the demise of the popular magazine, The Literary Digest.

In the 1948 presidential election, the use of quota sampling led the polls to inaccurately predict that Dewey would defeat Truman.
When conducting a survey, a sample can be chosen by chance or by more methodical methods.

Even when using probability sampling methods, bias can still occur.

The Gallup Poll is a public opinion poll that conducts surveys in 140 countries around the world.
Telephone surveys can reach a wide range of people very quickly and very inexpensively.
Chance error and bias are two different forms of error associated with sampling.

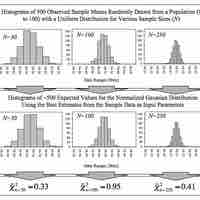
The sampling distribution of a statistic is the distribution of the statistic for all possible samples from the same population of a given size.
Knowledge of the sampling distribution can be very useful in making inferences about the overall population.
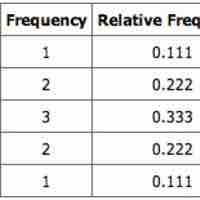
Learn to create a sampling distribution from a discrete set of data.
When we have a truly continuous distribution, it is not only impractical but actually impossible to enumerate all possible outcomes.
The mean of the distribution of differences between sample means is equal to the difference between population means.

The overall shape of a sampling distribution is expected to be symmetric and approximately normal.
The central limit theorem for sample means states that as larger samples are drawn, the sample means form their own normal distribution.
Expected value and standard error can provide useful information about the data recorded in an experiment.

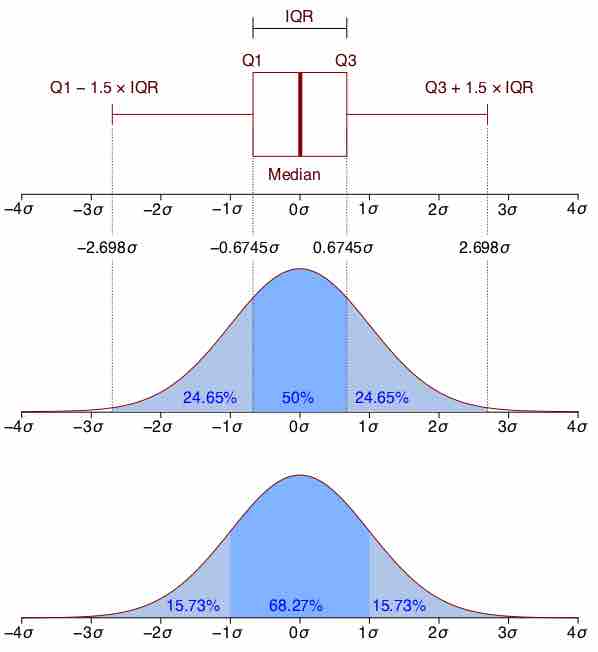
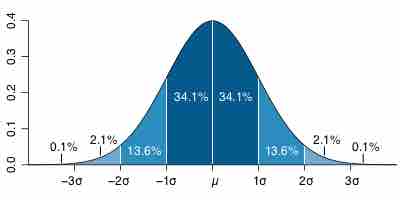
The normal curve is used to find the probability that a value falls within a certain standard deviation away from the mean.
The expected value is a weighted average of all possible values in a data set.
The Gallup Poll is an opinion poll that uses probability samples to try to accurately represent the attitudes and beliefs of a population.
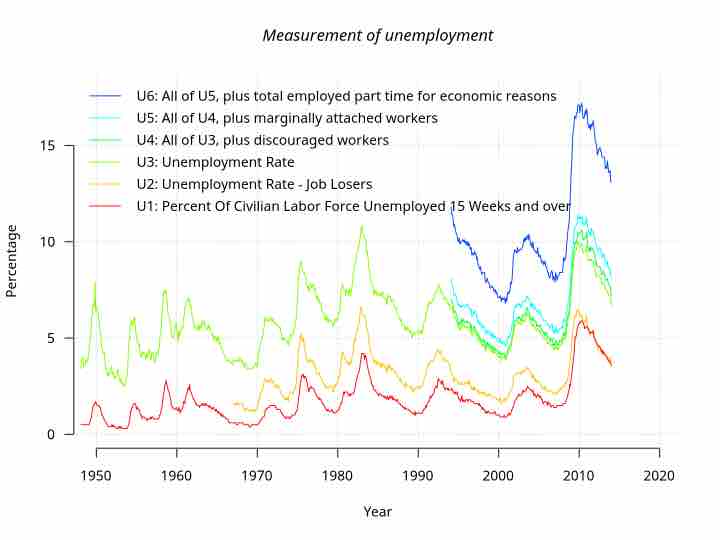
Labor force surveys are the most preferred method of measuring unemployment due to their comprehensive results and categories such as race and gender.
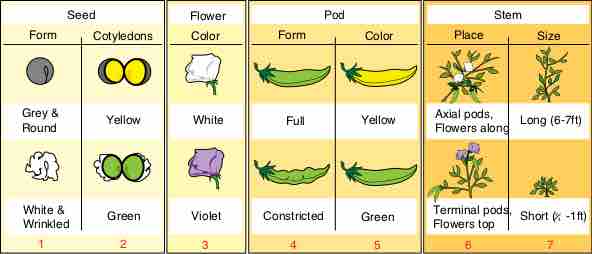
Gregor Mendel's work on genetics acted as a proof that application of statistics to inheritance could be highly useful.