The range is a measure of the total spread of values in a quantitative dataset.
Variance is the sum of the probabilities that various outcomes will occur multiplied by the squared deviations from the average of the random variable.
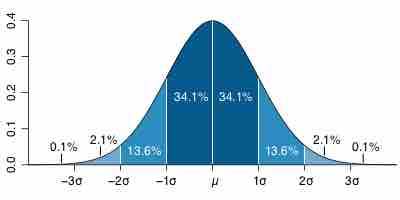
Standard deviation is a measure of the average distance between the values of the data in the set and the mean.
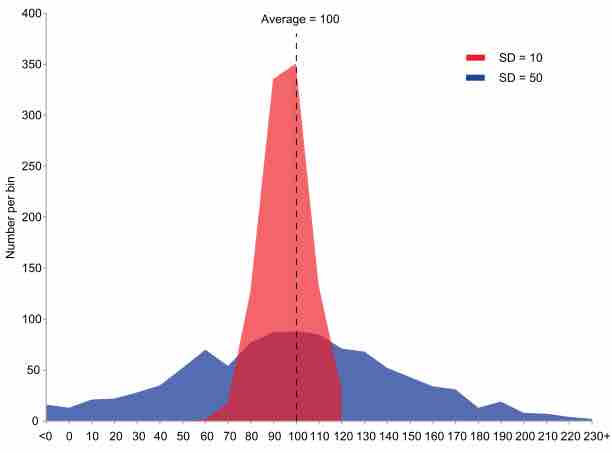
The practical value of understanding the standard deviation of a set of values is in appreciating how much variation there is from the mean.
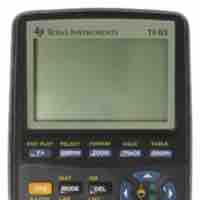
For advanced calculating and graphing, it is often very helpful for students and statisticians to have access to statistical calculators.
The number of degrees of freedom is the number of values in the final calculation of a statistic that are free to vary.
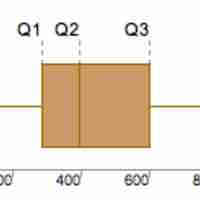
The interquartile range (IQR) is a measure of statistical dispersion, or variability, based on dividing a data set into quartiles.
Variability for qualitative data is measured in terms of how often observations differ from one another.
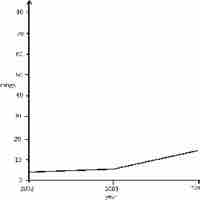
Descriptive statistics can be manipulated in many ways that can be misleading, including the changing of scale and statistical bias.
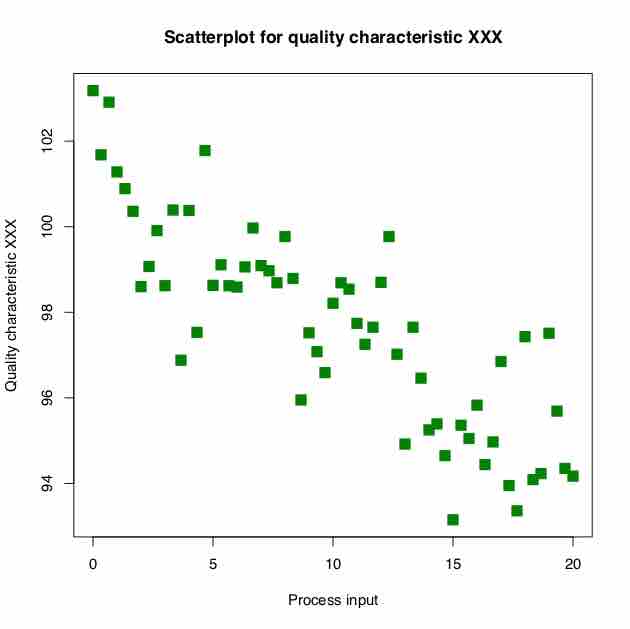
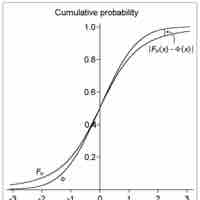
Exploratory data analysis is an approach to analyzing data sets in order to summarize their main characteristics, often with visual methods.