
The sampling distribution of a statistic is the distribution of the statistic for all possible samples from the same population of a given size.
Knowledge of the sampling distribution can be very useful in making inferences about the overall population.
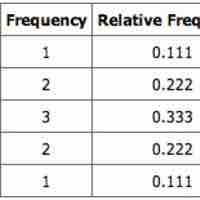
Learn to create a sampling distribution from a discrete set of data.
When we have a truly continuous distribution, it is not only impractical but actually impossible to enumerate all possible outcomes.
The mean of the distribution of differences between sample means is equal to the difference between population means.
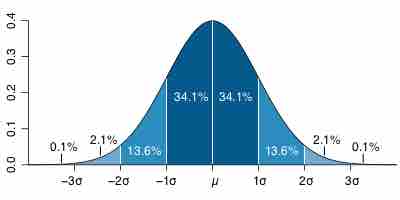
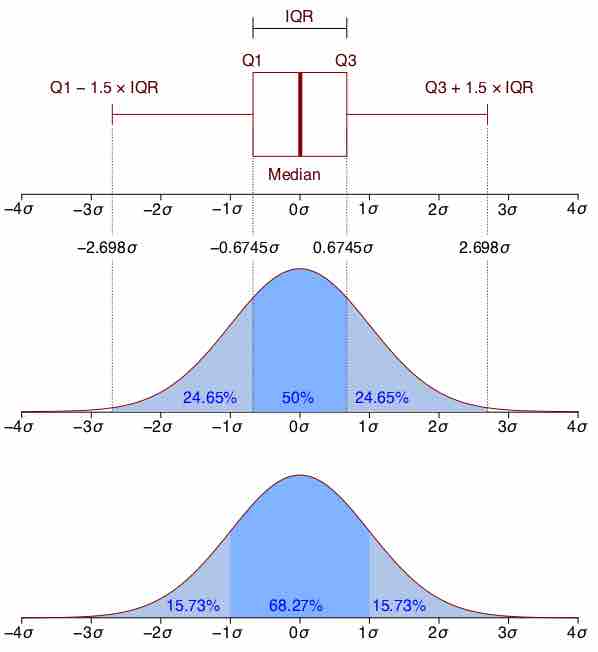
The overall shape of a sampling distribution is expected to be symmetric and approximately normal.
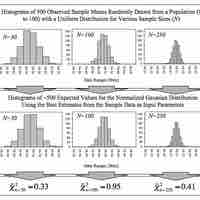
The central limit theorem for sample means states that as larger samples are drawn, the sample means form their own normal distribution.