Correlation refers to any of a broad class of statistical relationships involving dependence.
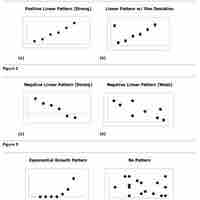
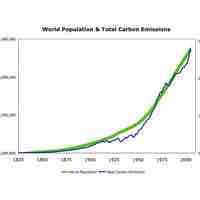
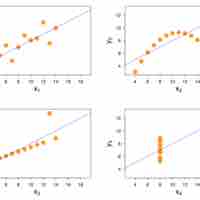
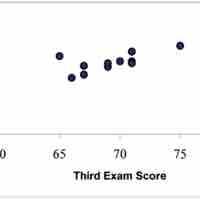
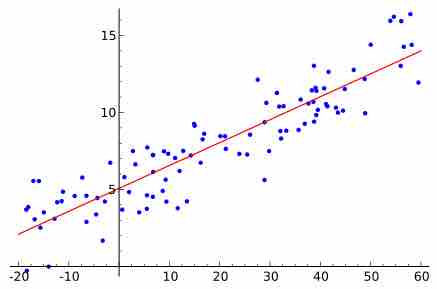
A scatter diagram is a type of mathematical diagram using Cartesian coordinates to display values for two variables in a set of data.
The correlation coefficient is a measure of the linear dependence between two variables
The coefficient of determination provides a measure of how well observed outcomes are replicated by a model.
The trend line (line of best fit) is a line that can be drawn on a scatter diagram representing a trend in the data.
Other types of correlation coefficients include intraclass correlation and the concordance correlation coefficient.
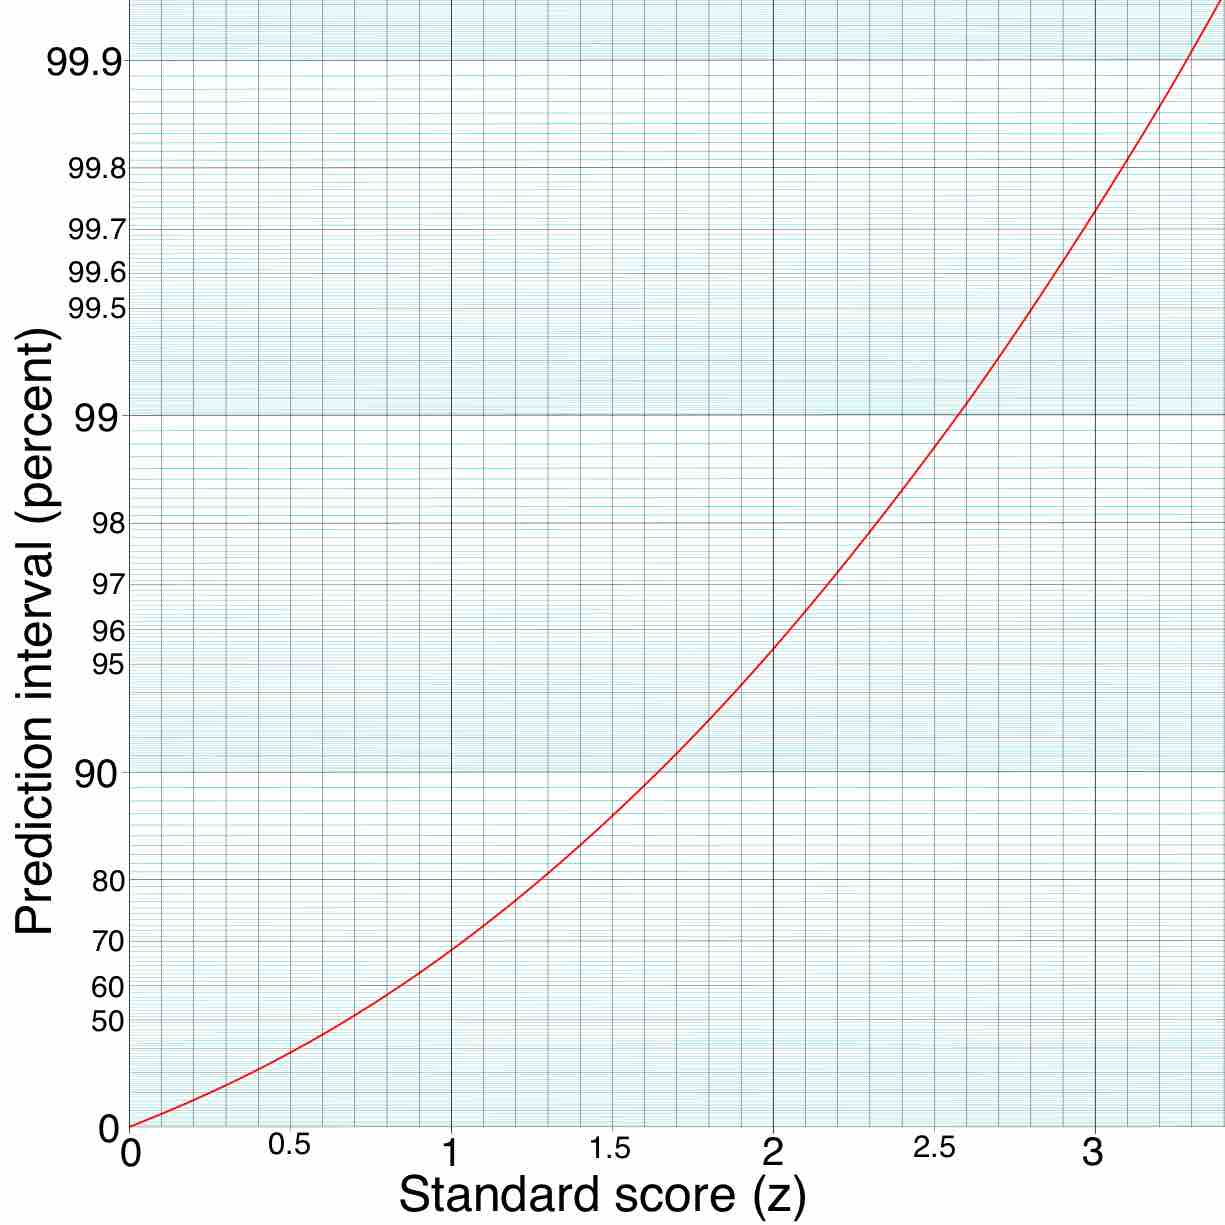
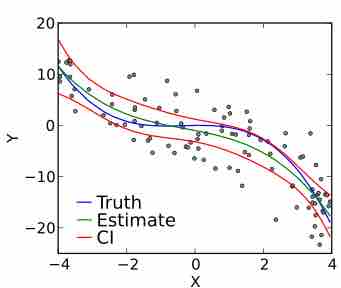
A prediction interval is an estimate of an interval in which future observations will fall with a certain probability given what has already been observed.
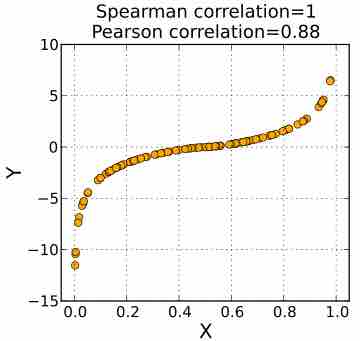
A rank correlation is a statistic used to measure the relationship between rankings of ordinal variables or different rankings of the same variable.
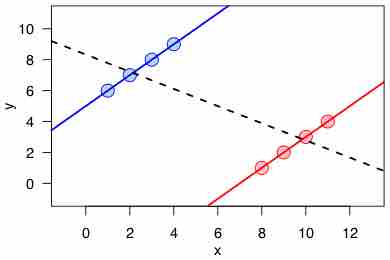
An ecological fallacy is an interpretation of statistical data where inferences about individuals are deduced from inferences about the group as a whole.
The conventional dictum "correlation does not imply causation" means that correlation cannot be used to infer a causal relationship between variables.
Regression models are often used to predict a response variable

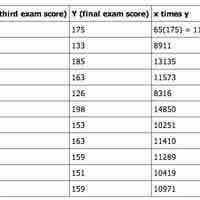
A graph of averages and the least-square regression line are both good ways to summarize the data in a scatterplot.
The regression method utilizes the average from known data to make predictions about new data.
The regression fallacy fails to account for natural fluctuations and rather ascribes cause where none exists.
In the regression line equation the constant
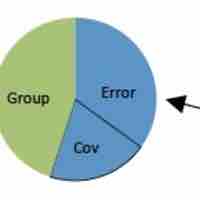
ANCOVA can be used to compare regression lines by testing the effect of a categorial value on a dependent variable, controlling the continuous covariate.
The criteria for determining the least squares regression line is that the sum of the squared errors is made as small as possible.

Standard linear regression models with standard estimation techniques make a number of assumptions.
The slope of the best fit line tells us how the dependent variable
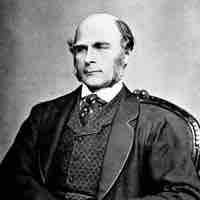
Regression toward the mean says that if a variable is extreme on its 1st measurement, it will tend to be closer to the average on its 2nd.
RMS error measures the differences between values predicted by a model or an estimator and the values actually observed.
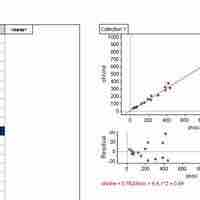
The residual plot illustrates how far away each of the values on the graph is from the expected value (the value on the line).
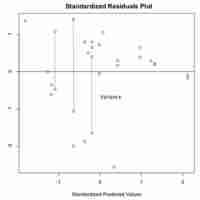
By drawing vertical strips on a scatter plot and analyzing the spread of the resulting new data sets, we are able to judge degree of homoscedasticity.

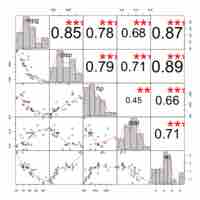
Multiple regression is used to find an equation that best predicts the

The purpose of a multiple regression is to find an equation that best predicts the
The results of multiple regression should be viewed with caution.

Standard multiple regression involves several independent variables predicting the dependent variable.
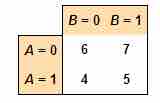
In regression analysis, an interaction may arise when considering the relationship among three or more variables.
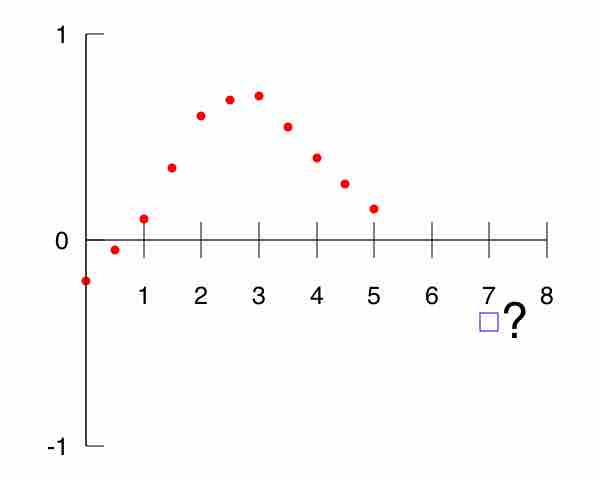
The goal of polynomial regression is to model a non-linear relationship between the independent and dependent variables.
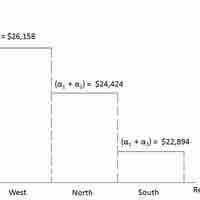
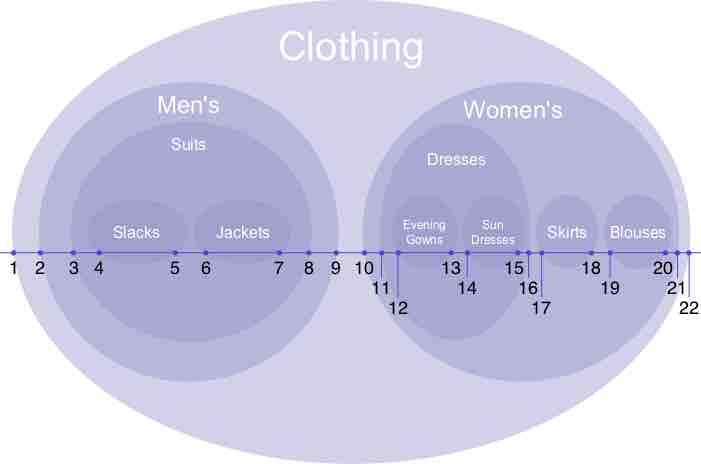
Dummy, or qualitative variables, often act as independent variables in regression and affect the results of the dependent variables.
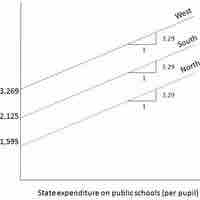
A regression model that contains a mixture of quantitative and qualitative variables is called an Analysis of Covariance (ANCOVA) model.
Multilevel (nested) models are appropriate for research designs where data for participants are organized at more than one level.
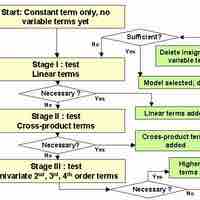
Stepwise regression is a method of regression modeling in which the choice of predictive variables is carried out by an automatic procedure.

There are a number of assumptions that must be made when using multiple regression models.
Some problems with multiple regression include multicollinearity, variable selection, and improper extrapolation assumptions.