3 concepts
Computing R.M.S. Error
RMS error measures the differences between values predicted by a model or an estimator and the values actually observed.
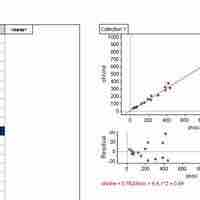
Plotting the Residuals
The residual plot illustrates how far away each of the values on the graph is from the expected value (the value on the line).
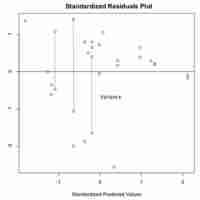
Homogeneity and Heterogeneity
By drawing vertical strips on a scatter plot and analyzing the spread of the resulting new data sets, we are able to judge degree of homoscedasticity.