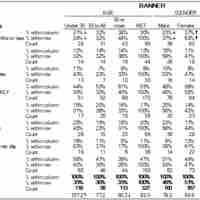
Cross tabulation (or crosstabs for short) is a statistical process that summarizes categorical data to create a contingency table.
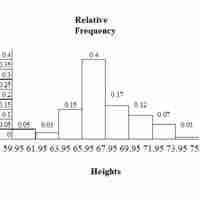
To draw a histogram, one must decide how many intervals represent the data, the width of the intervals, and the starting point for the first interval.
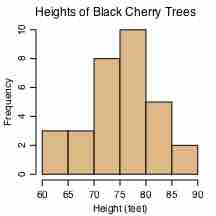
A histogram is a graphical representation of the distribution of data.
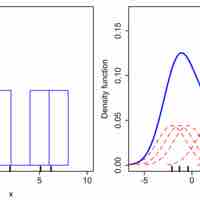
Density estimation is the construction of an estimate based on observed data of an unobservable, underlying probability density function.
A variable is any characteristic, number, or quantity that can be measured or counted.
Controlling for a variable is a method to reduce the effect of extraneous variations that may also affect the value of the dependent variable.
Selective breeding is a field concerned with testing hypotheses and theories of evolution by using controlled experiments.
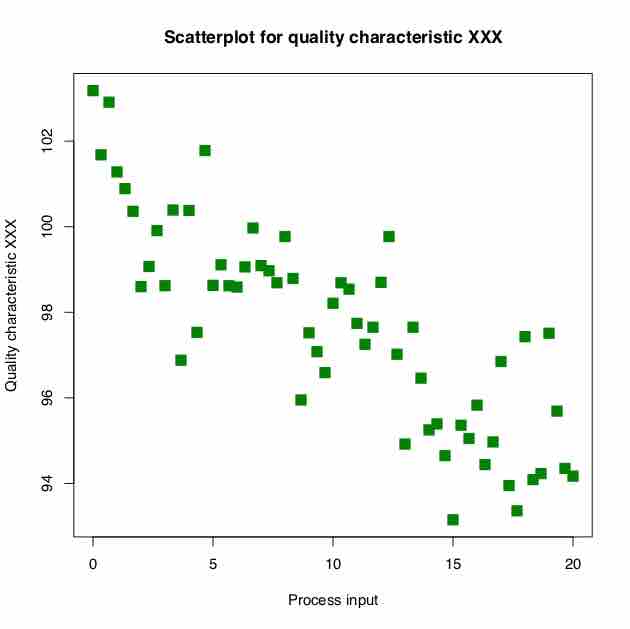
Statistical graphics allow results to be displayed in some sort of pictorial form and include scatter plots, histograms, and box plots.
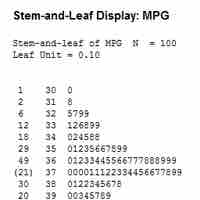
A stem-and-leaf display presents quantitative data in a graphical format to assist in visualizing the shape of a distribution.
A graph is a representation of a set of objects where some pairs of the objects are connected by links.
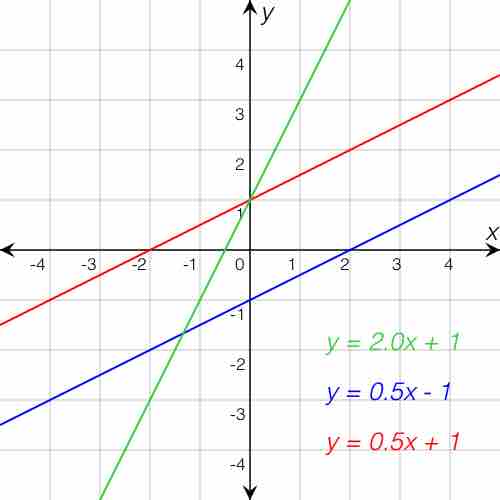
A plot is a graphical technique for representing a data set, usually as a graph showing the relationship between two or more variables.
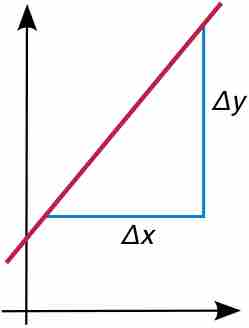
The concepts of slope and intercept are essential to understand in the context of graphing data.
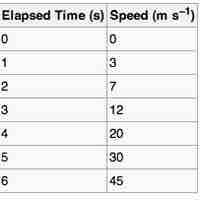
A line graph is a type of chart which displays information as a series of data points connected by straight line segments.
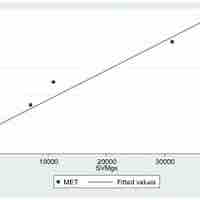
In statistics, linear regression can be used to fit a predictive model to an observed data set of