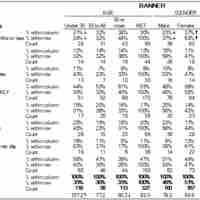
Cross tabulation (or crosstabs for short) is a statistical process that summarizes categorical data to create a contingency table.
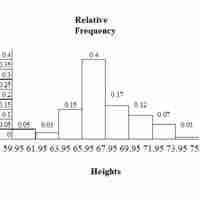
To draw a histogram, one must decide how many intervals represent the data, the width of the intervals, and the starting point for the first interval.
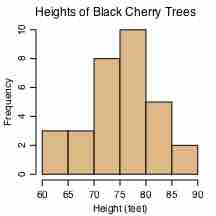
A histogram is a graphical representation of the distribution of data.
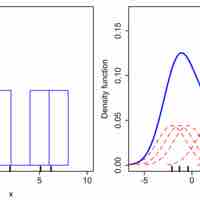
Density estimation is the construction of an estimate based on observed data of an unobservable, underlying probability density function.
A variable is any characteristic, number, or quantity that can be measured or counted.

Controlling for a variable is a method to reduce the effect of extraneous variations that may also affect the value of the dependent variable.
Selective breeding is a field concerned with testing hypotheses and theories of evolution by using controlled experiments.