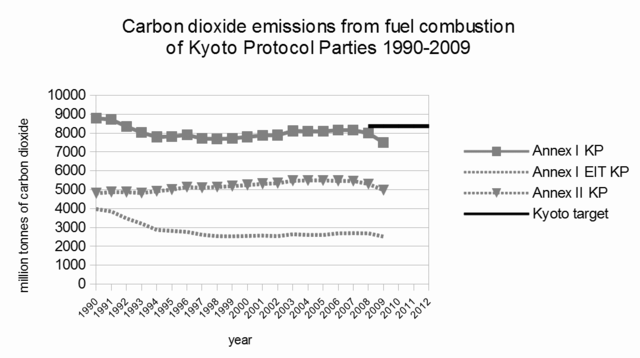
English: This graph shows the carbon dioxide (CO
2) emissions from fuel combustion of Annex I Kyoto Protocol Parties between 1990 and 2009. The 2008-2012 Kyoto target is also plotted. The graph is based on data from the International Energy Agency (IEA, 2011). The Kyoto target is calculated as a percentage of 1990 CO
2 emissions from fuel combustion only. It therefore does not represent the total target for the six-gas basket (see Kyoto Protocol for details). The target as presented here assumes that the reduction targets are spread equally across all gases (IEA, 2011).
The graph shows that the emissions of Annex I Kyoto Protocol (KP) Parties have been uneven between 1990 and 2009. In 1990, emissions were about 8,800 million tonnes (Mt) CO2, declined then stabilized over the 1990s, grew slowly in the 2000s, reaching about 8,100 MtCO2 in 2007, then fell to about 7,500 MtCO2 in 2009. Emissions in 2008 and 2009 were below the Kyoto target of about 8,400 MtCO2, which applies between 2008-2012.
For Annex I " Economies in Transition" (EIT) KP Parties (i.e., the former economies of the Soviet Union), emissions declined between 1990-1999 (1990 emissions = about 4,000 MtCO2; 1999 emissions = about 2,500 MtCO2), grew slowly up to 2007 (2007 emissions = about 2,700 MtCO2), and then declined in 2009 (about 2,500 MtCO2).
For Annex II KP Parties (i.e., Annex I KP Parties minus the EIT KP Parties), emissions in 1990 were about 4,800 MtCO2, gradually increased and peaked around 2004 (about 5,500 MtCO2), before falling to about 5,000 MtCO2 in 2009.
References: CO
2 Emissions From Fuel Combustion: Highlights (2011 edition), author: International Energy Agency (IEA), publisher: IEA, Paris, France, p.13. The IEA has made data from this publication freely available to download as an Excel (XLS) spreadsheet (1,008 KB).


