 |
This is a file from the Wikimedia Commons. Information from its description page there is shown below.
Commons is a freely licensed media file repository. You can help.
|
| Description |
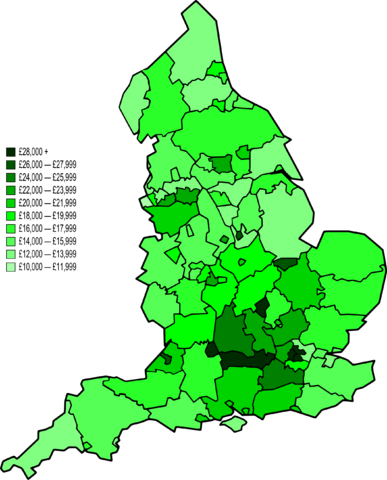
A map of England divided by NUTS 3 level subdivisons. They are coloured on a ten shade scale of green with light green having the lowest average GVA per capita in 2007 to dark green for the highest. England average is £20,458. |
| Date |
27 May 2010 |
| Source |
Most of the map's structure came from Image:BlankMap-EnglandSubdivisions.svg, although several merging and splitting of subdivisons was done by Jolly Janner using Inkscape. The data was from a report by the Office for National Statistics (URL: page 31-33). |
| Author |
Kanguole and Jolly Janner. |
Permission
( Reusing this file) |
Must attribute Kanguole.
|
Licensing
 |
Permission is granted to copy, distribute and/or modify this document under the terms of the GNU Free Documentation License, Version 1.2 or any later version published by the Free Software Foundation; with no Invariant Sections, no Front-Cover Texts, and no Back-Cover Texts.
Subject to disclaimers.www.gnu.org/copyleft/fdl.htmlGFDLGNU Free Documentation Licensetruetrue
|
File usage
The following pages on Schools Wikipedia link to this image (list may be incomplete):


