Summary
| Description |
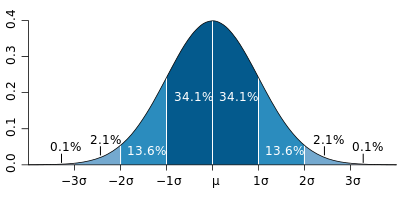
English: Normal distribution curve that illustrates standard deviations. Each band has 1 standard deviation, and the labels indicate the approximate proportion of area (note: these add up to 99.8%, and not 100% due to rounding for presentation.)
|
| Date |
7 April 2007 |
| Source |
Own work, based (in concept) on figure by Jeremy Kemp, on 2005-02-09 |
| Author |
Mwtoews |
Figure source code
This figure was made with R using:
# # External package to generate four shades of blue
# library(RColorBrewer)
# cols <- rev(brewer.pal(4, "Blues"))
cols <- c("#2171B5", "#6BAED6", "#BDD7E7", "#EFF3FF")

# Sequence between -4 and 4 with 0.1 steps
x <- seq(-4, 4, 0.1)

# Plot an empty chart with tight axis boundaries, and axis lines on bottom and left
plot(x, type="n", xaxs="i", yaxs="i", xlim=c(-4, 4), ylim=c(0, 0.4),
     bty="l", xaxt="n", xlab="x-value", ylab="probability density")

# Function to plot each coloured portion of the curve, between "a" and "b" as a
# polygon; the function "dnorm" is the normal probability density function
polysection <- function(a, b, col, n=11){
    dx <- seq(a, b, length.out=n)
    polygon(c(a, dx, b), c(0, dnorm(dx), 0), col=col, border=NA)
    # draw a white vertical line on "inside" side to separate each section
    segments(a, 0, a, dnorm(a), col="white")
}

# Build the four left and right portions of this bell curve
for(i in 0:3){
    polysection(   i, i+1,  col=cols[i+1]) # Right side of 0
    polysection(-i-1,  -i,  col=cols[i+1]) # Left right of 0
}

# Black outline of bell curve
lines(x, dnorm(x))

# Bottom axis values, where sigma represents standard deviation and mu is the mean
axis(1, at=-3:3, labels=expression(-3*sigma, -2*sigma, -1*sigma, mu,
                                    1*sigma,  2*sigma,  3*sigma))

# Add percent densities to each division (rounded to 1 decimal place), between x and x+1
pd <- sprintf("%.1f%%", 100*(pnorm(1:4) - pnorm(0:3)))
text(c((0:3)+0.5,(0:-3)-0.5), c(0.16, 0.05, 0.04, 0.02), pd, col=c("white","white","black","black"))
segments(c(-2.5, -3.5, 2.5, 3.5), dnorm(c(2.5, 3.5)), c(-2.5, -3.5, 2.5, 3.5), c(0.03, 0.01))\
|
|
This chart was created with R. |
Licensing

 |
This file is licensed under the Creative Commons Attribution 2.5 Generic license. |
|
|
|
- You are free:
- to share – to copy, distribute and transmit the work
- to remix – to adapt the work
- Under the following conditions:
- attribution – You must attribute the work in the manner specified by the author or licensor (but not in any way that suggests that they endorse you or your use of the work).
http://creativecommons.org/licenses/by/2.5 CC-BY-2.5 Creative Commons Attribution 2.5 truetrue
|
The following pages on Schools Wikipedia link to this image (list may be incomplete):


