
The operating margin is a ratio that determines how much money a company is actually making in profit and equals operating income divided by revenue.
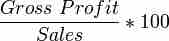
Profit margin measures the amount of profit a company earns from its sales and is calculated by dividing profit (gross or net) by sales.
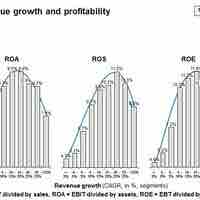
The return on assets ratio (ROA) measures how effectively assets are being used for generating profit.
The Basic Earning Power ratio (BEP) is Earnings Before Interest and Taxes (EBIT) divided by Total Assets.
Return on equity (ROE) measures how effective a company is at using its equity to generate income and is calculated by dividing net profit by total equity.

Inventory turnover is a measure of the number of times inventory is sold or used in a time period, such as a year.
Days sales outstanding (also called DSO or days receivables) is a calculation used by a company to estimate their average collection period.

Fixed-asset turnover is the ratio of sales to value of fixed assets, indicating how well the business uses fixed assets to generate sales.

Total asset turnover is a financial ratio that measures the efficiency of a company's use of its assets in generating sales revenue.

Current ratio is a financial ratio that measures whether or not a firm has enough resources to pay its debts over the next 12 months.
The Acid Test or Quick Ratio measures the ability of a company to use its assets to retire its current liabilities immediately.

The DuPont equation is an expression which breaks return on equity down into three parts: profit margin, asset turnover, and leverage.
Return on equity measures the rate of return on the ownership interest of a business and is irrelevant if earnings are not reinvested or distributed.
Sustainable-- as opposed to internal-- growth gives a company a better idea of its growth rate while keeping in line with financial policy.

The dividend payout and retention ratios offer insight into how much of a firm's profit is distributed to shareholders versus retained.
Return on assets is a component of return on equity, both of which can be used to calculate a company's rate of growth.

With a few exceptions, the majority of the data used in ratio analysis comes from evaluation of the financial statements.

While ratio analysis can be quite helpful in comparing companies within an industry, cross-industry comparisons should be done with caution.
Comparing the financial ratios of a company to those of the top performer in its class is a type of benchmarking.
Trend analysis consists of using ratios to compare company performance on an indicator over time, often to forecast or inform future events.
Financial statement analyses can yield a limited view of a company because of accounting, market, and management related limitations of such analyses.
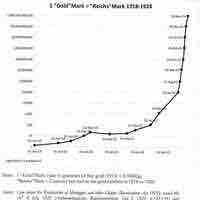
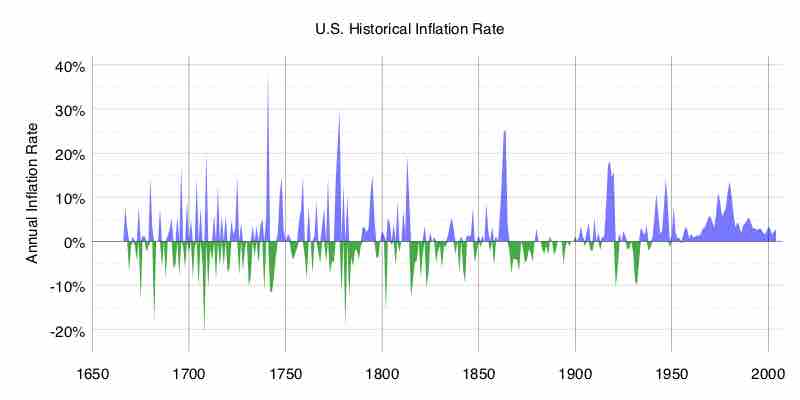
General price level changes creates distortions in financial statements. Inflation accounting is used in countries with high inflation.
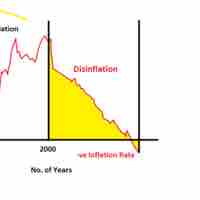
Disinflation is a decrease in the inflation rate; a slowdown in the rate of increase of the general price level of goods, services.
Deflation is a decrease in the general price level of goods and services and occurs when the inflation rate falls below 0%.