
In general, the law of demand states that the quantity demanded and the price of a good or service is inversely related, other things remaining constant.
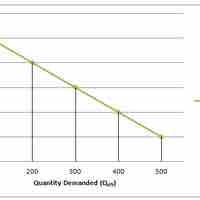
A demand curve depicts the price and quantity combinations listed in a demand schedule.
Market demand is the summation of the individual quantities that consumers are willing to purchase at a given price.
Ceteris paribus is defined as "all else being equal," or "holding all else constant".

Demand is the relationship between the willingness to purchase a quantity of a good or service at a specific price.
The law of supply states that there is a positive relationship between the quantity that suppliers are willing to sell and the price level.
A supply schedule is a tabular depiction of the relationship between price and quantity supplied, represented graphically as a supply curve.

Market supply is the summation of the individual supply curves within a specific market where the market is characterized as being perfectly competitive.
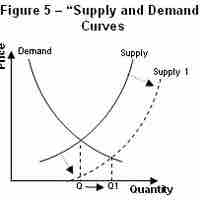
Supply levels are determined by price, which increases or decreases supply along the price curve, and non-price factors, which shifts the entire curve.
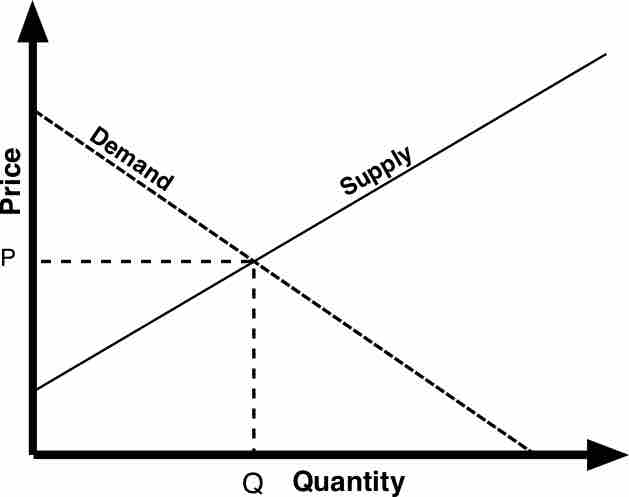
The supply curve depicts the supplier's positive relationship between price and quantity.
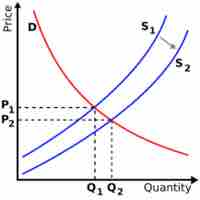
When a market achieves perfect equilibrium there is no excess supply or demand, which theoretically results in a market clearing.
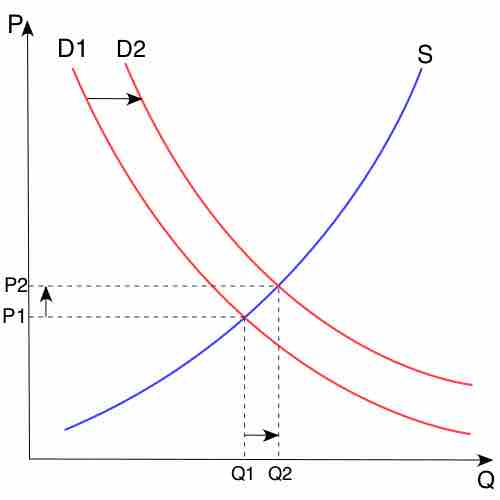
The existence of surpluses or shortages in supply will result in disequilibrium, or a lack of balance between supply and demand levels.
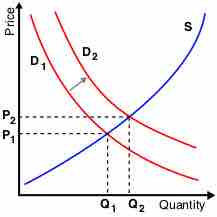
Alterations to overall supply or demand dictate the cross-section or equilibrium, ascertaining price and volume for a product or service.

Governments intervene in markets when they inefficiently allocate resources.

A price ceiling is a price control that limits how high a price can be charged for a good or service.
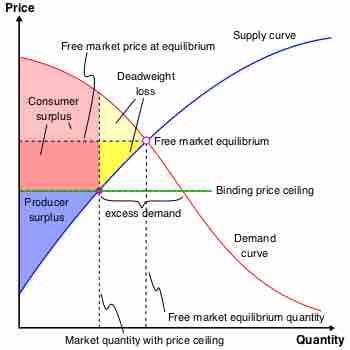
A binding price ceiling will create a surplus of supply and will lead to a decrease in economic surplus.

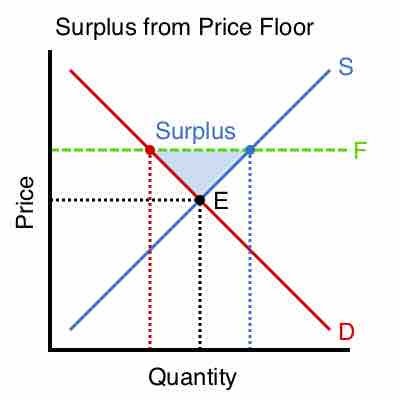
A binding price floor is a price control that limits how low a price can be charged for a product or service.

Binding price floors typically cause excess supply and decreased total economic surplus.
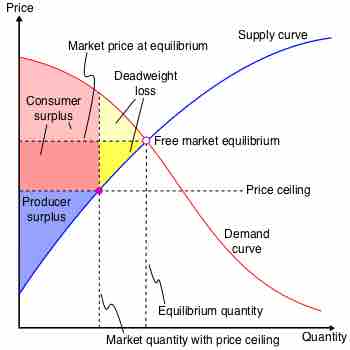
Deadweight loss is the decrease in economic efficiency that occurs when a good or service is not priced at its pareto optimal level.
Many argue that price controls ensure resource availability, but most economists agree that these controls should be used sparingly.

Governments use its tax systems to raise funds for its programs and influence its citizens' economic actions.
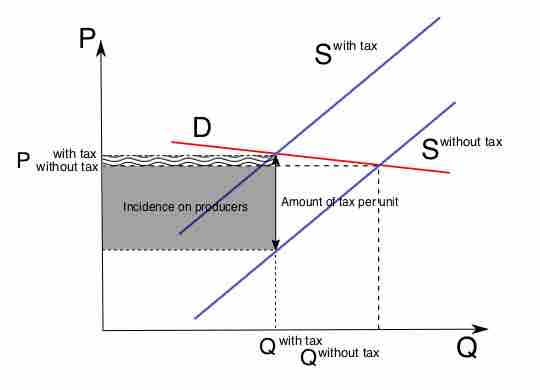
Tax incidence falls mostly upon the group that responds least to price, or has the most inelastic price-quantity curve.