Chapter 23
Inflation and Unemployment
By Boundless
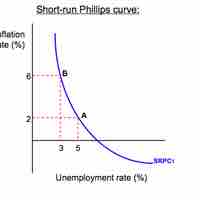
The Phillips curve shows the inverse relationship between inflation and unemployment: as unemployment decreases, inflation increases.
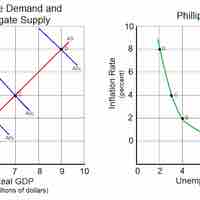
Changes in aggregate demand cause movements along the Phillips curve, all other variables held constant.
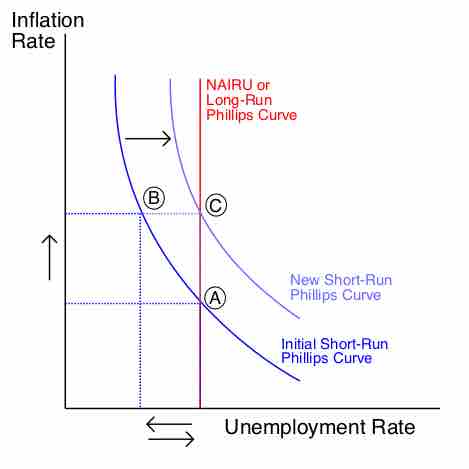
The long-run Phillips curve is a vertical line at the natural rate of unemployment, so inflation and unemployment are unrelated in the long run.
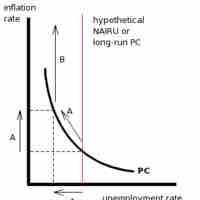
The short-run Phillips curve depicts the inverse trade-off between inflation and unemployment.
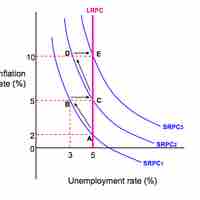
There are two theories of expectations (adaptive or rational) that predict how people will react to inflation.
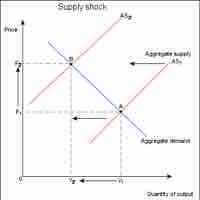
Aggregate supply shocks, such as increases in the costs of resources, can cause the Phillips curve to shift.
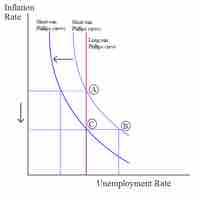
Disinflation is a decline in the rate of inflation, and can be caused by declines in the money supply or recessions in the business cycle.