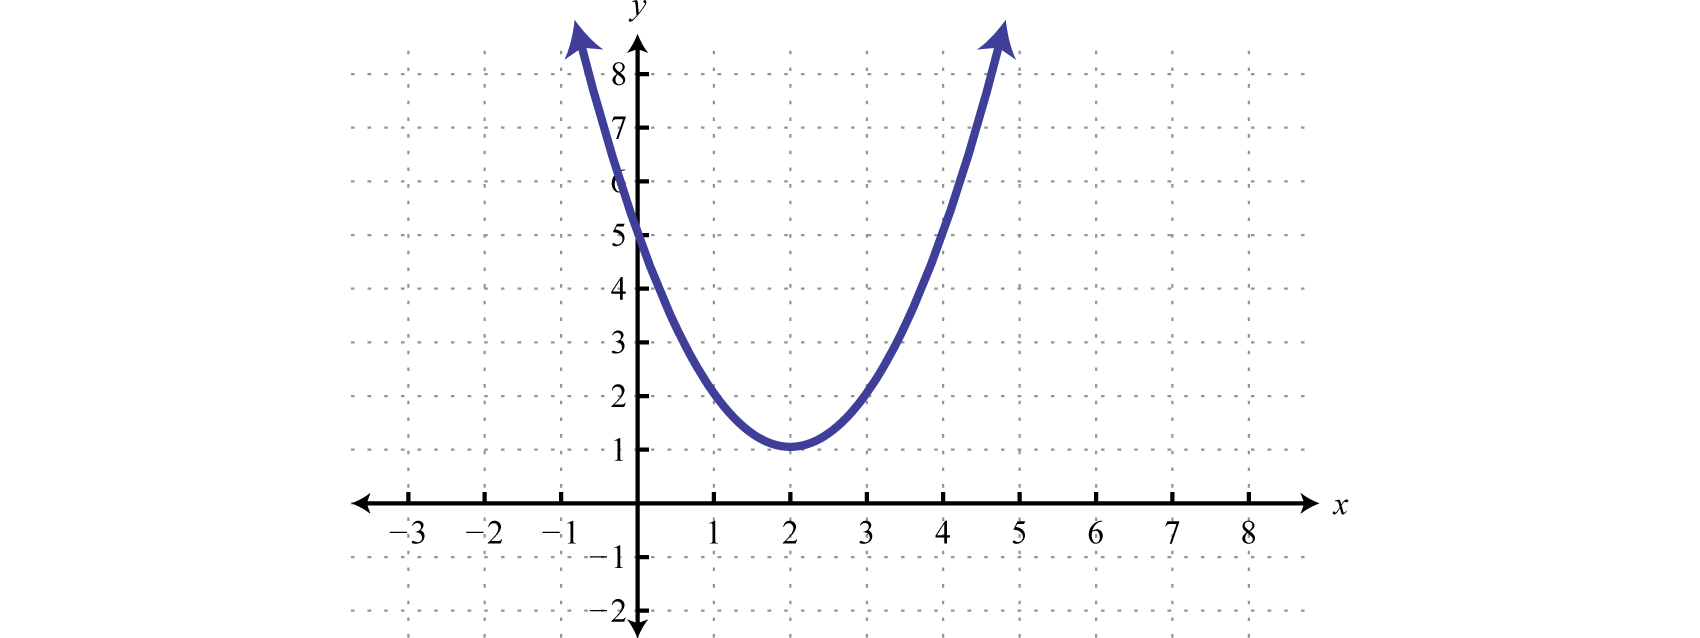
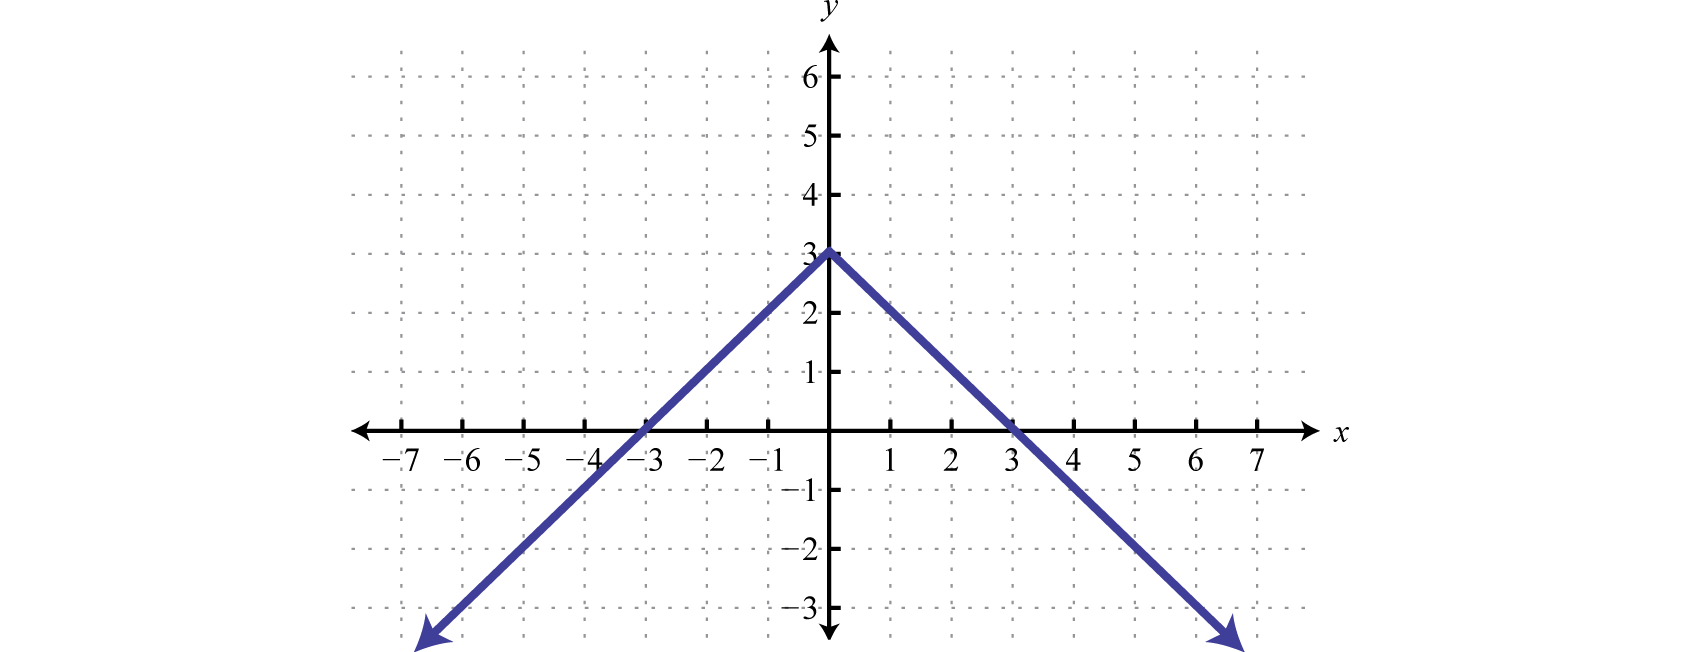
When the graph of a function is changed in appearance and/or location we call it a transformation. There are two types of transformations. A rigid transformationA set of operations that change the location of a graph in a coordinate plane but leave the size and shape unchanged. changes the location of the function in a coordinate plane, but leaves the size and shape of the graph unchanged. A non-rigid transformationA set of operations that change the size and/or shape of a graph in a coordinate plane. changes the size and/or shape of the graph.
A vertical translationA rigid transformation that shifts a graph up or down. is a rigid transformation that shifts a graph up or down relative to the original graph. This occurs when a constant is added to any function. If we add a positive constant to each y-coordinate, the graph will shift up. If we add a negative constant, the graph will shift down. For example, consider the functions and Begin by evaluating for some values of the independent variable x.

Now plot the points and compare the graphs of the functions g and h to the basic graph of , which is shown using a dashed grey curve below.
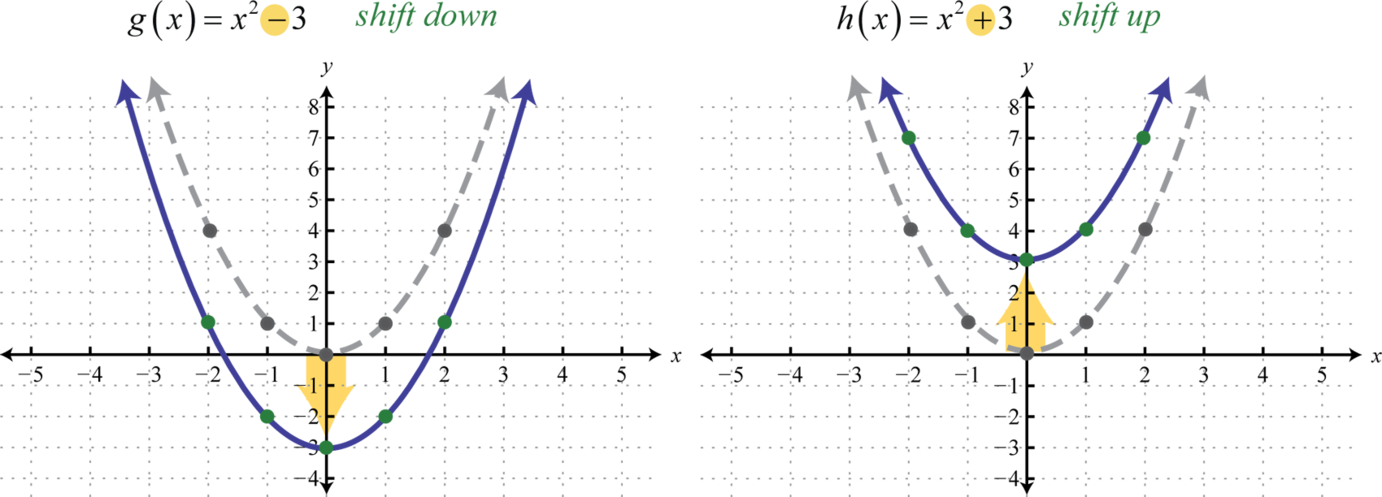
The function g shifts the basic graph down 3 units and the function h shifts the basic graph up 3 units. In general, this describes the vertical translations; if k is any positive real number:
Vertical shift up k units: |
|
Vertical shift down k units: |
Sketch the graph of
Solution:
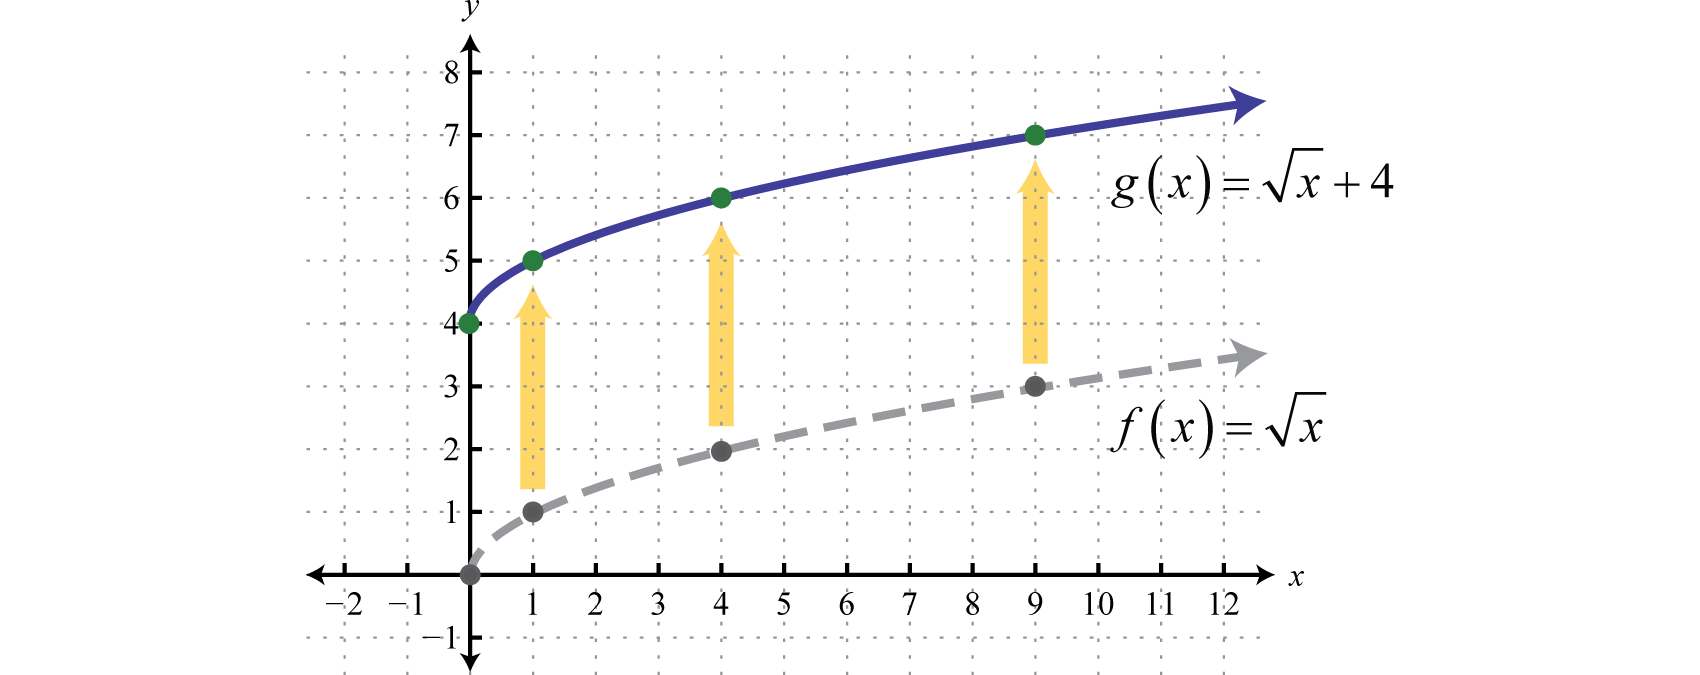
Begin with the basic function defined by and shift the graph up 4 units.
Answer:
A horizontal translationA rigid transformation that shifts a graph left or right. is a rigid transformation that shifts a graph left or right relative to the original graph. This occurs when we add or subtract constants from the x-coordinate before the function is applied. For example, consider the functions defined by and and create the following tables:
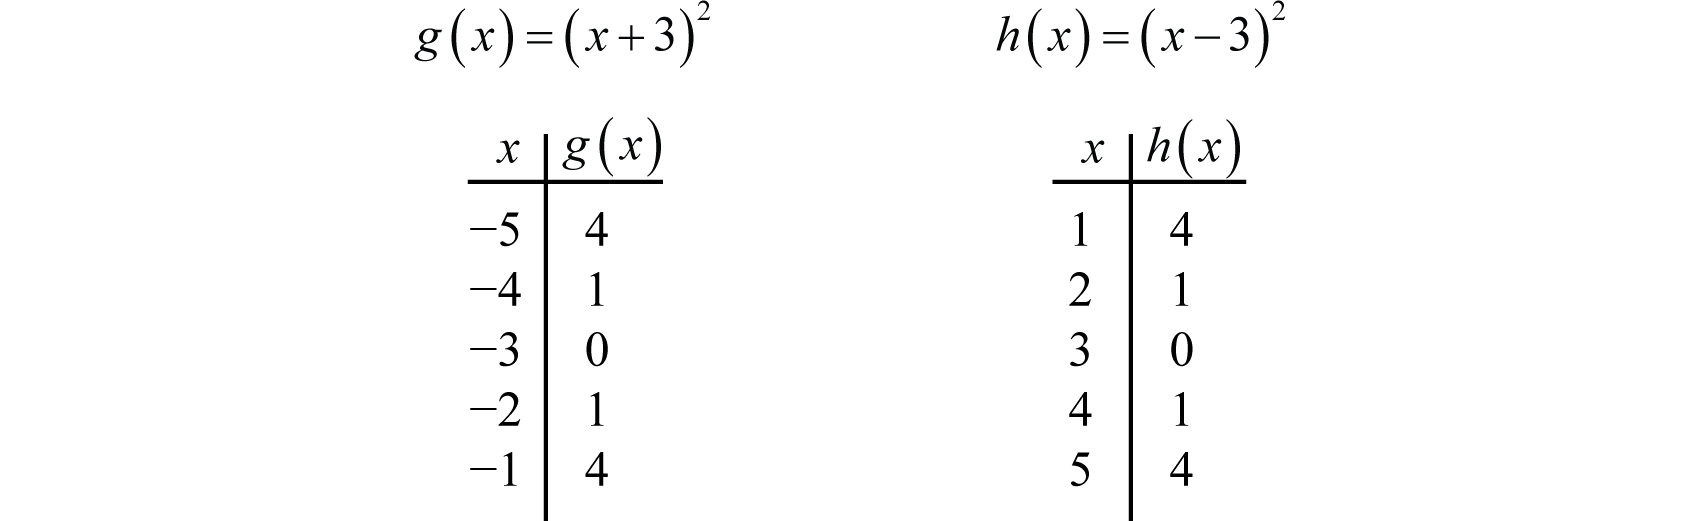
Here we add and subtract from the x-coordinates and then square the result. This produces a horizontal translation.
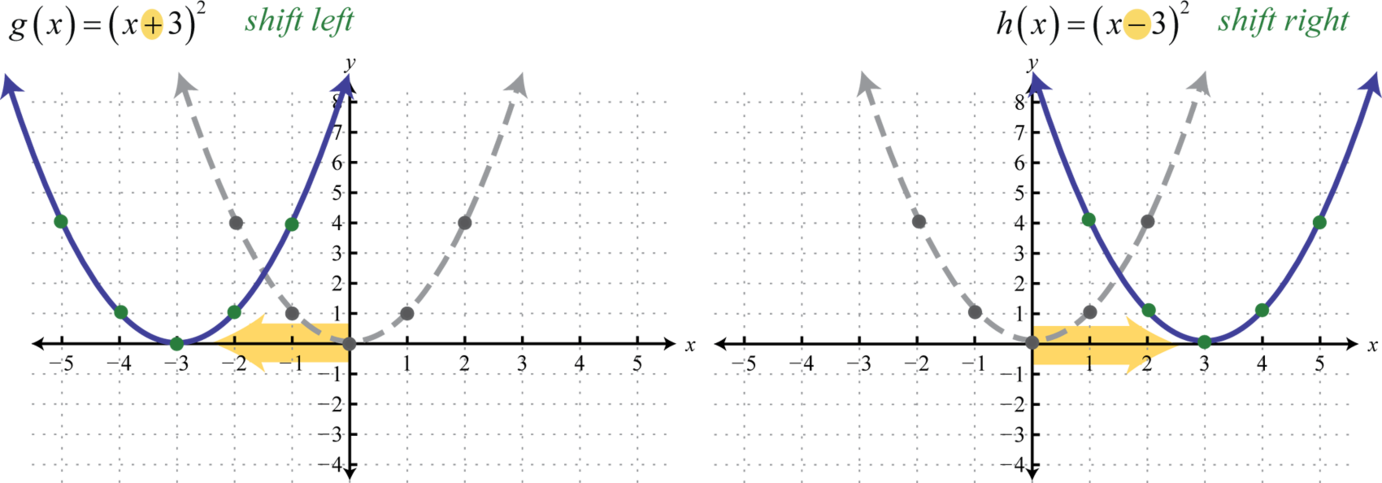
Note that this is the opposite of what you might expect. In general, this describes the horizontal translations; if h is any positive real number:
Horizontal shift left h units: |
|
Horizontal shift right h units: |
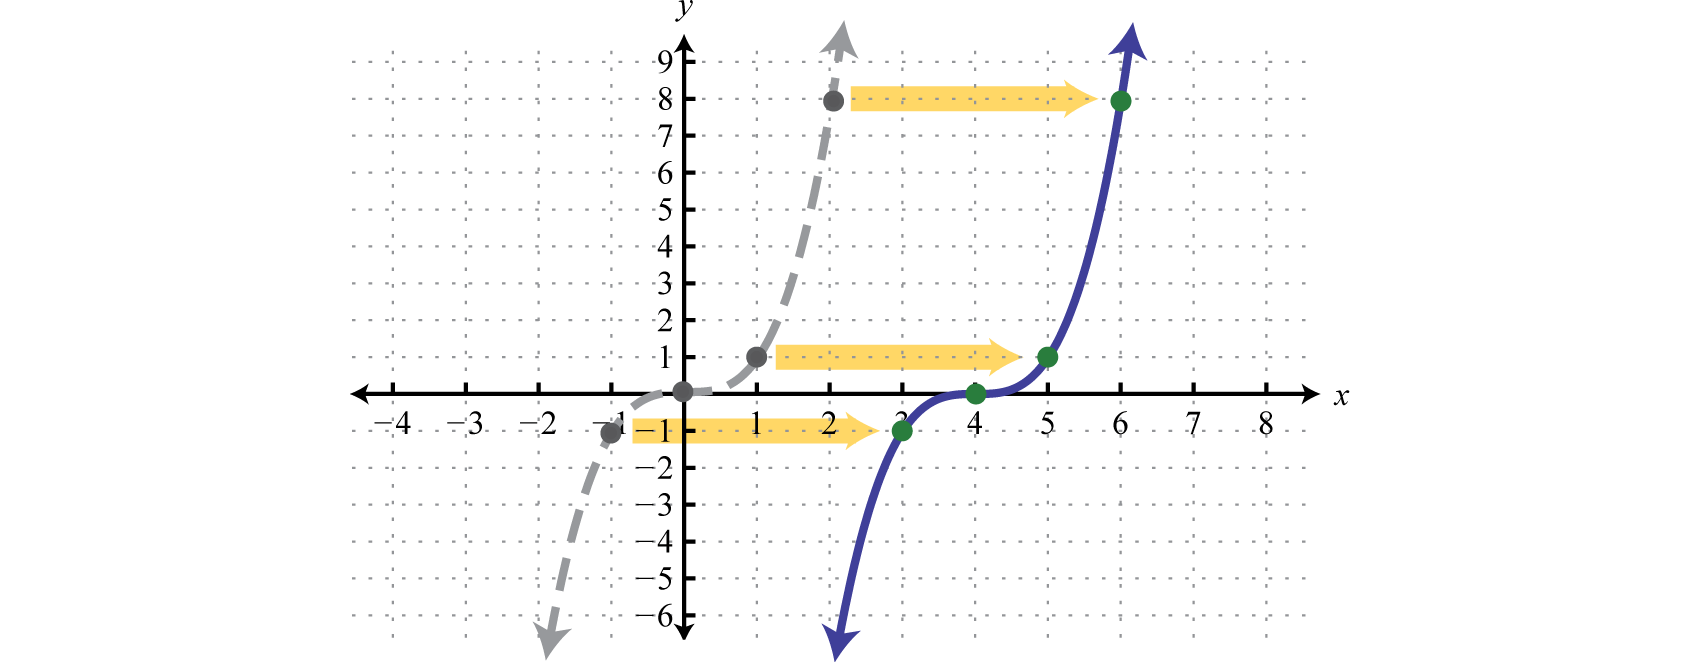
Sketch the graph of
Solution:
Begin with a basic cubing function defined by and shift the graph 4 units to the right.
Answer:
It is often the case that combinations of translations occur.
Sketch the graph of
Solution:
Start with the absolute value function and apply the following transformations.
Answer:
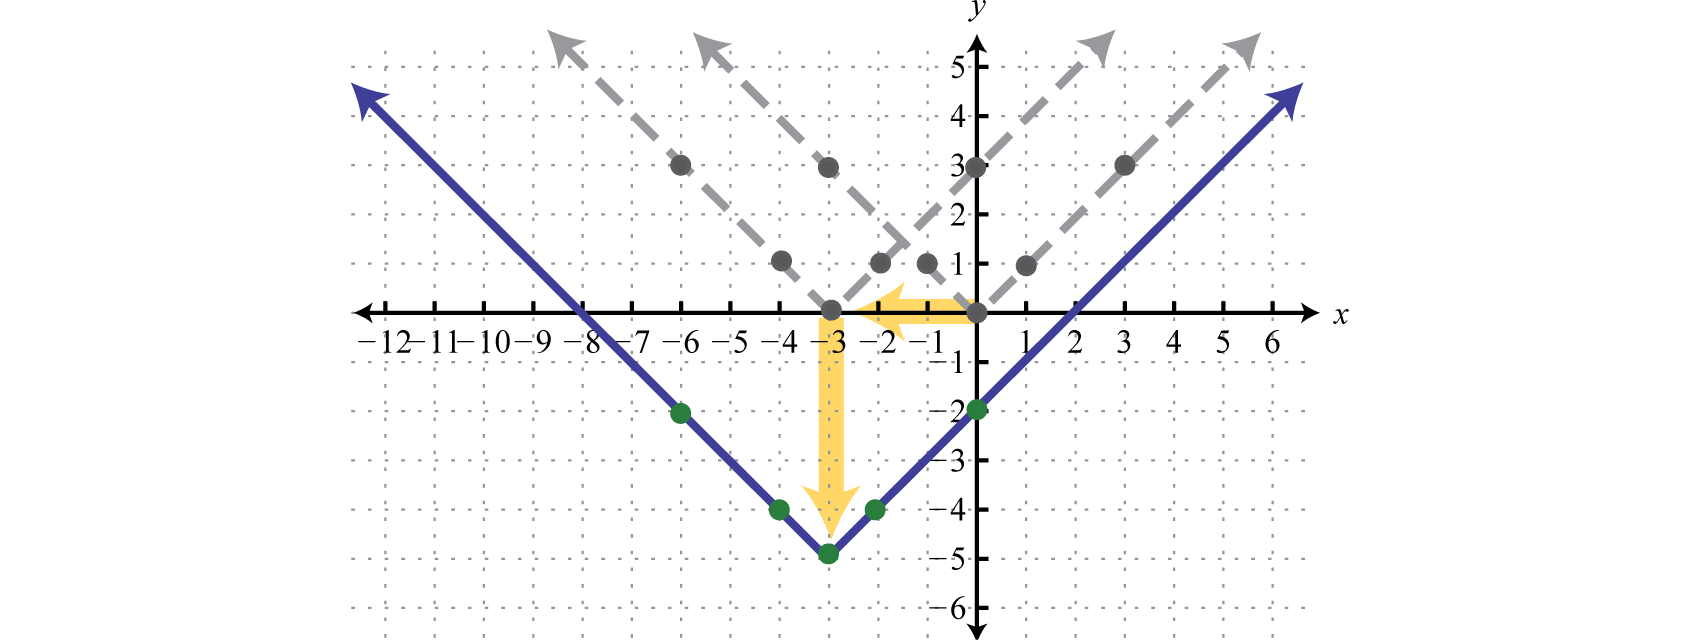
The order in which we apply horizontal and vertical translations does not affect the final graph.
Sketch the graph of
Solution:
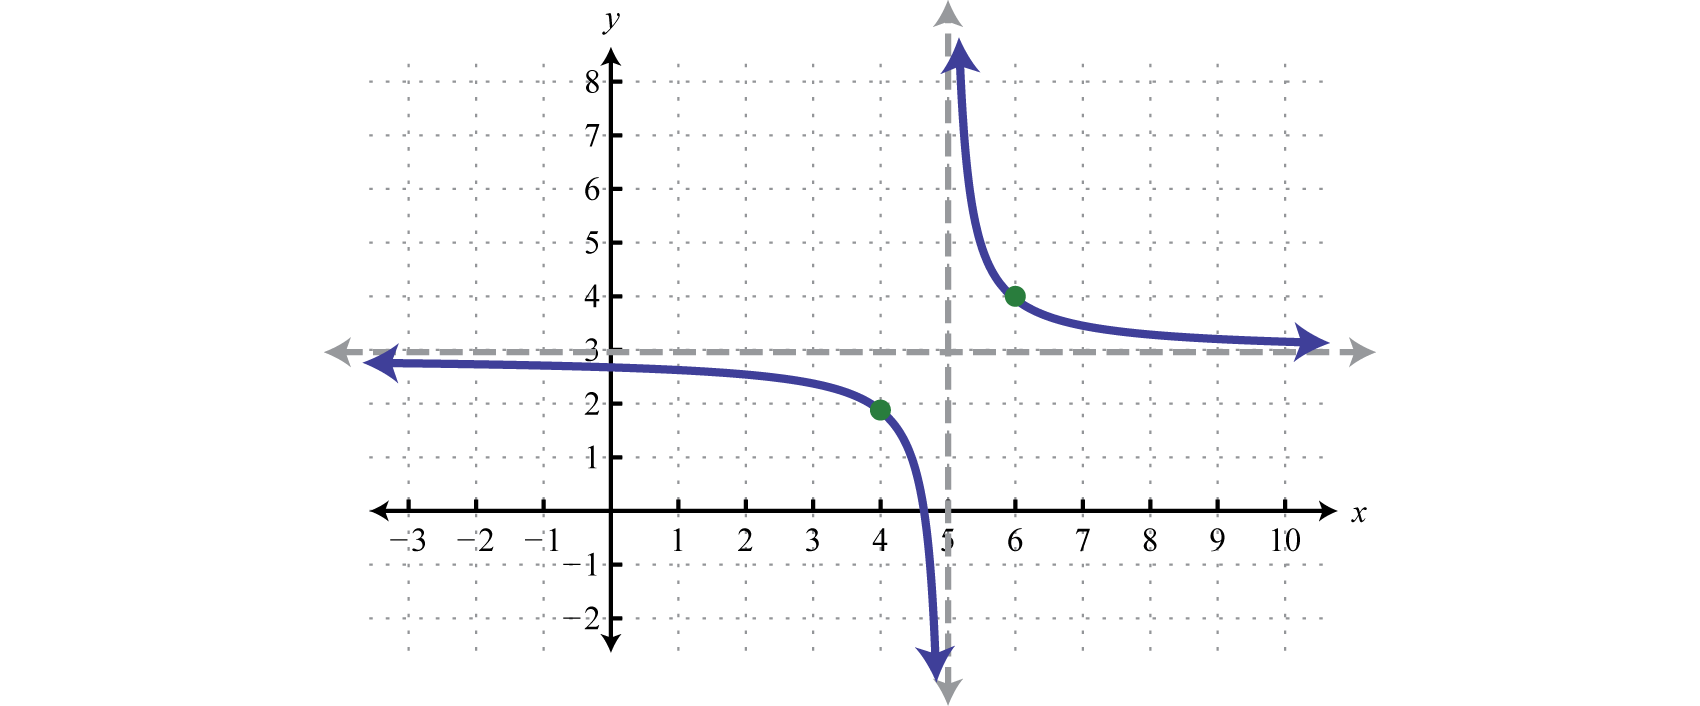
Begin with the reciprocal function and identify the translations.
Take care to shift the vertical asymptote from the y-axis 5 units to the right and shift the horizontal asymptote from the x-axis up 3 units.
Answer:
A reflectionA transformation that produces a mirror image of the graph about an axis. is a transformation in which a mirror image of the graph is produced about an axis. In this section, we will consider reflections about the x- and y-axis. The graph of a function is reflected about the x-axis if each y-coordinate is multiplied by −1. The graph of a function is reflected about the y-axis if each x-coordinate is multiplied by −1 before the function is applied. For example, consider and

Compare the graph of g and h to the basic square root function defined by , shown dashed in grey below:
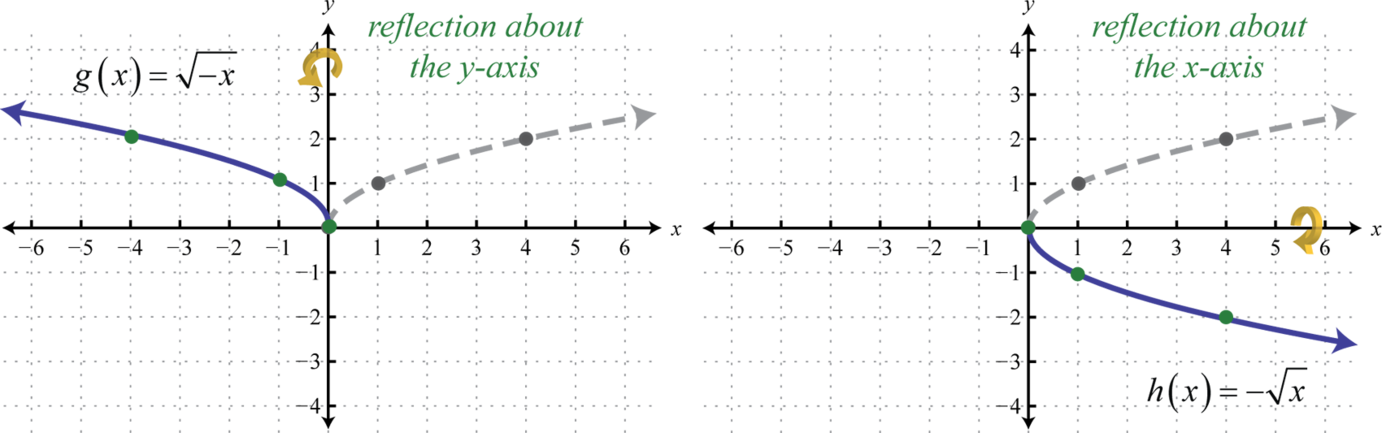
The first function g has a negative factor that appears “inside” the function; this produces a reflection about the y-axis. The second function h has a negative factor that appears “outside” the function; this produces a reflection about the x-axis. In general, it is true that:
Reflection about the y-axis: |
|
Reflection about the x-axis: |
When sketching graphs that involve a reflection, consider the reflection first and then apply the vertical and/or horizontal translations.
Sketch the graph of
Solution:
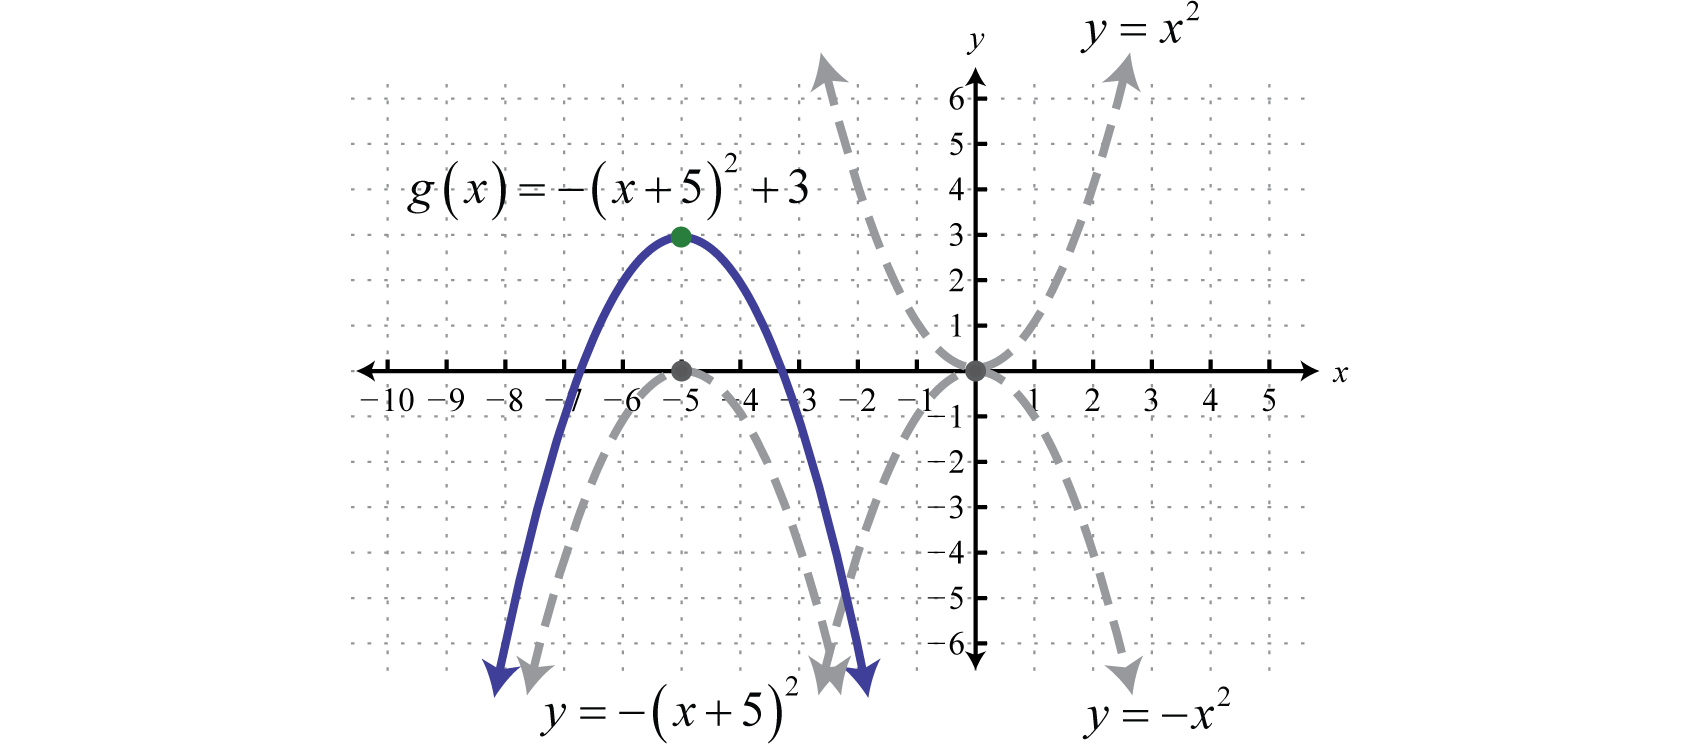
Begin with the squaring function and then identify the transformations starting with any reflections.
Use these translations to sketch the graph.
Answer:
Horizontal and vertical translations, as well as reflections, are called rigid transformations because the shape of the basic graph is left unchanged, or rigid. Functions that are multiplied by a real number other than 1, depending on the real number, appear to be stretched vertically or stretched horizontally. This type of non-rigid transformation is called a dilationA non-rigid transformation, produced by multiplying functions by a nonzero real number, which appears to stretch the graph either vertically or horizontally.. For example, we can multiply the squaring function by 4 and to see what happens to the graph.

Compare the graph of g and h to the basic squaring function defined by , shown dashed in grey below:
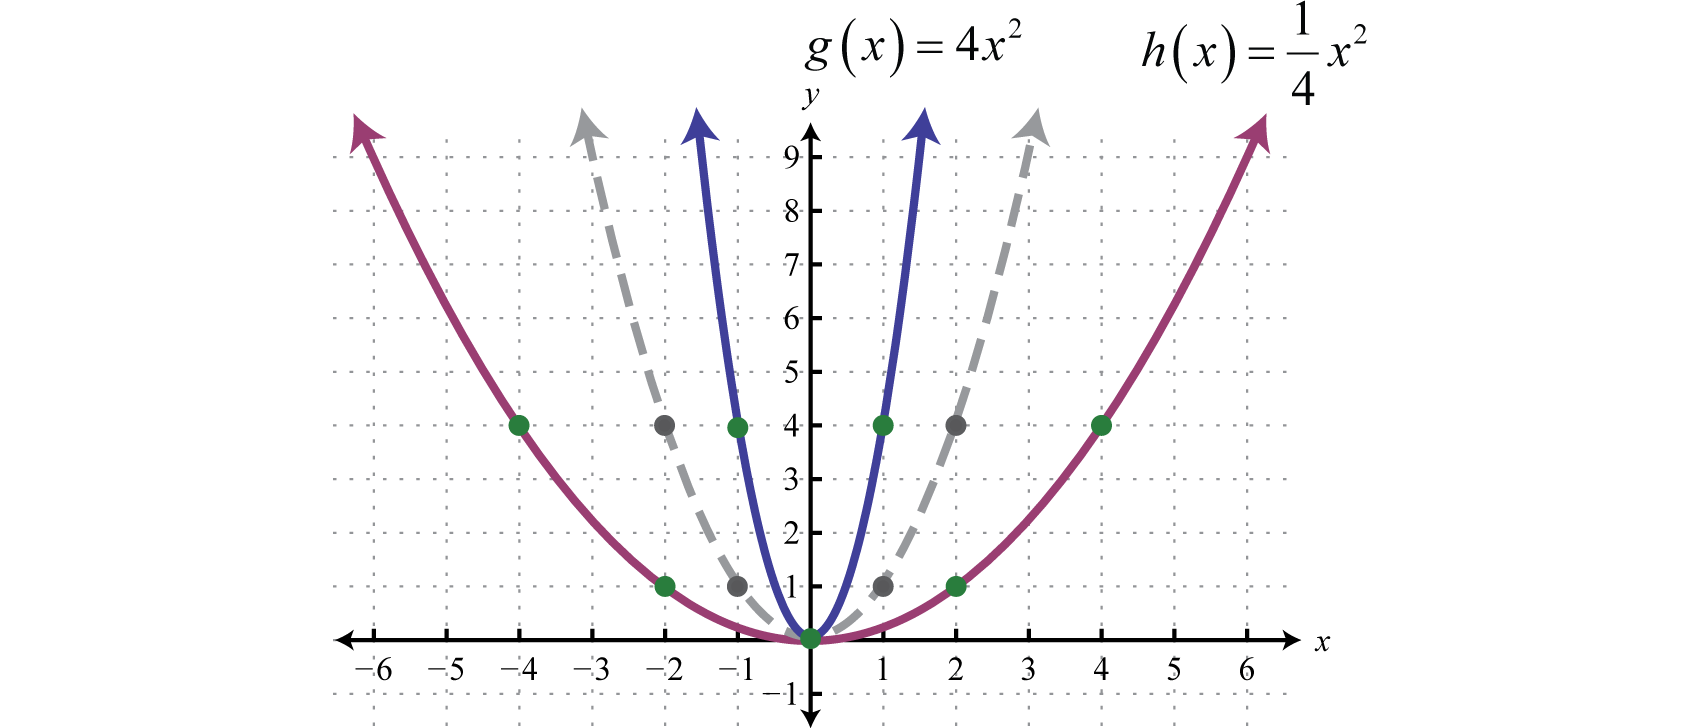
The function g is steeper than the basic squaring function and its graph appears to have been stretched vertically. The function h is not as steep as the basic squaring function and appears to have been stretched horizontally.
In general, we have:
Dilation: |
If the factor a is a nonzero fraction between −1 and 1, it will stretch the graph horizontally. Otherwise, the graph will be stretched vertically. If the factor a is negative, then it will produce a reflection as well.
Sketch the graph of
Solution:
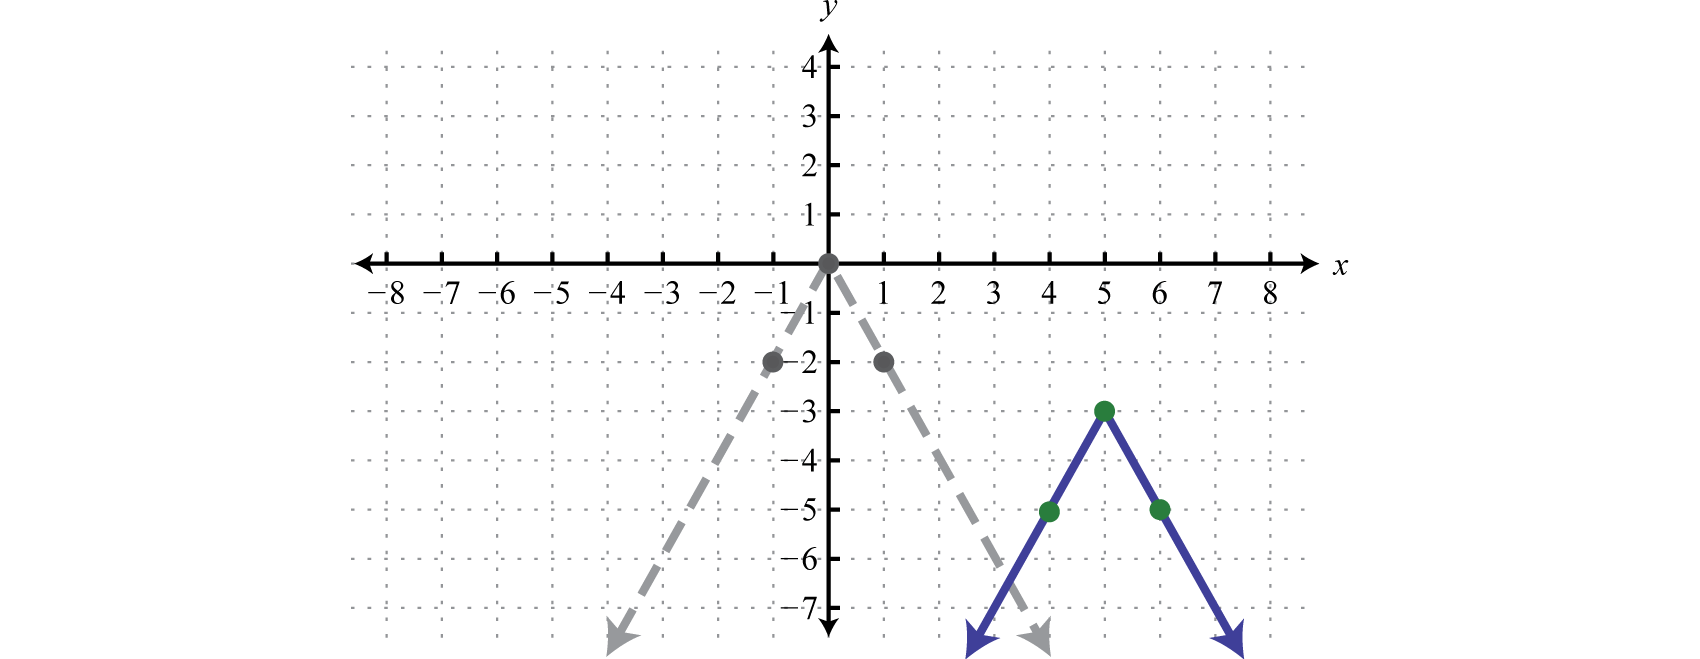
Here we begin with the product of −2 and the basic absolute value function: This results in a reflection and a dilation.
Use the points {(−1, −2), (0, 0), (1, −2)} to graph the reflected and dilated function Then translate this graph 5 units to the right and 3 units down.
Answer:
In summary, given positive real numbers h and k:
Vertical shift up k units: |
|
Vertical shift down k units: |
Horizontal shift left h units: |
|
Horizontal shift right h units: |
Reflection about the y-axis: |
|
Reflection about the x-axis: |
Dilation: |
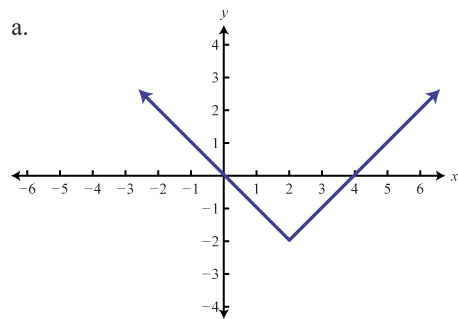
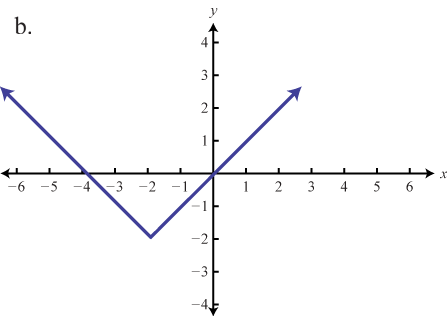
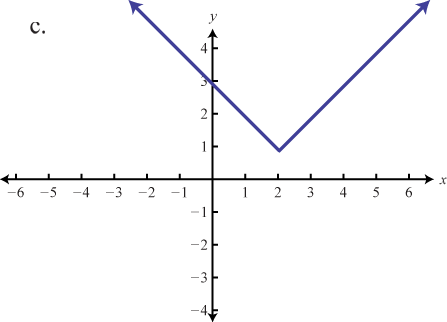
Match the graph to the function definition.
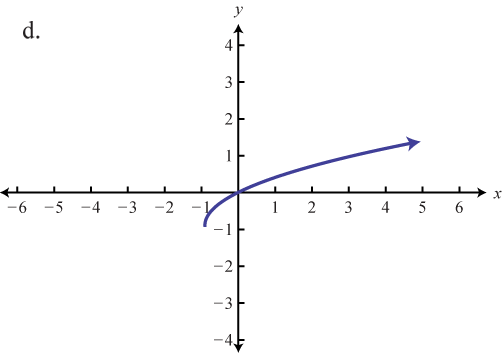
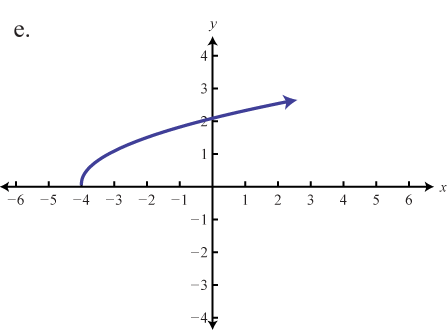
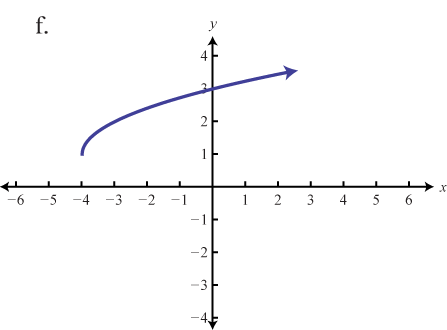
Graph the given function. Identify the basic function and translations used to sketch the graph. Then state the domain and range.
Graph the piecewise functions.
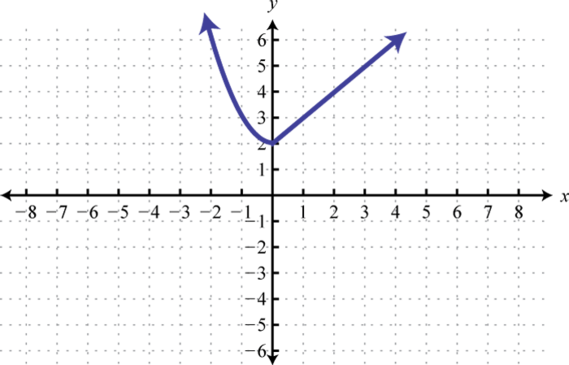
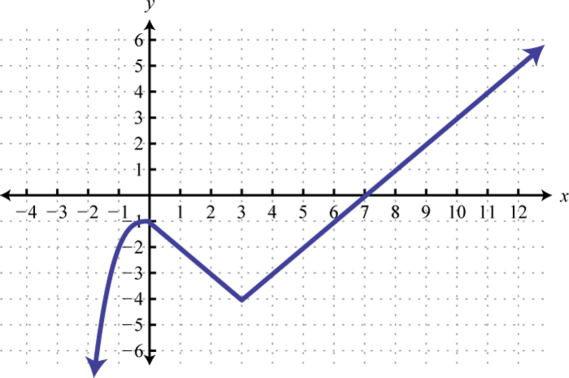
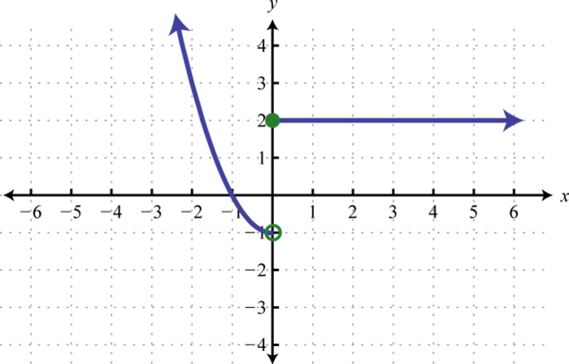
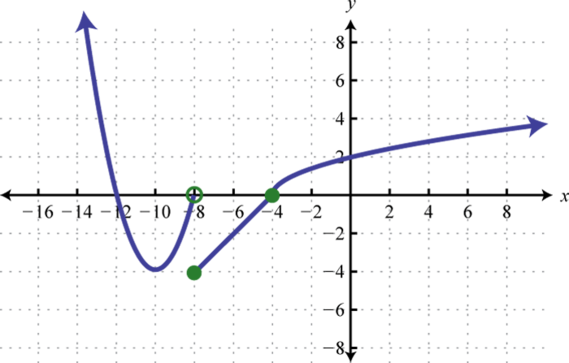
Write an equation that represents the function whose graph is given.
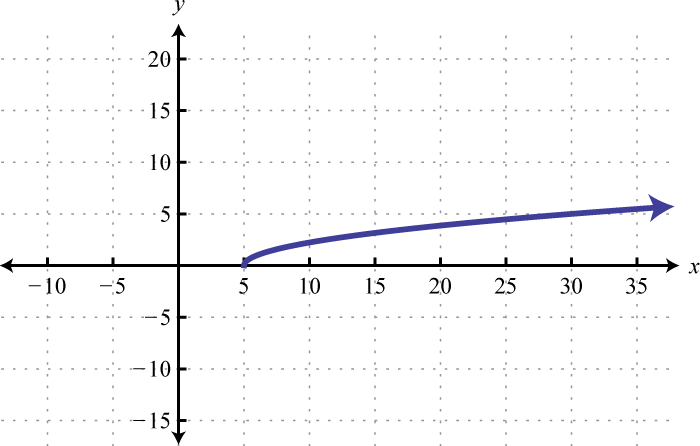
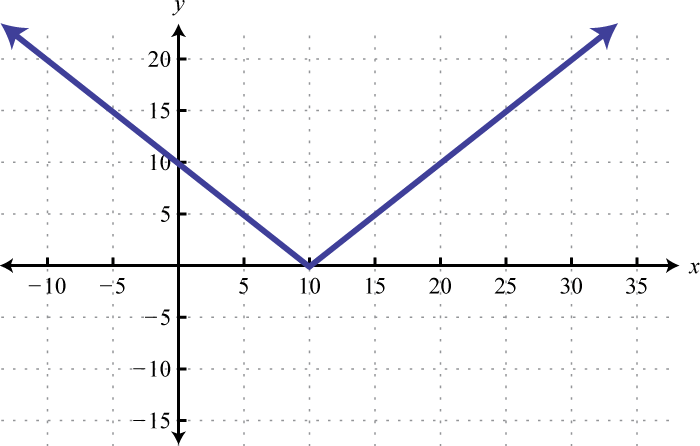
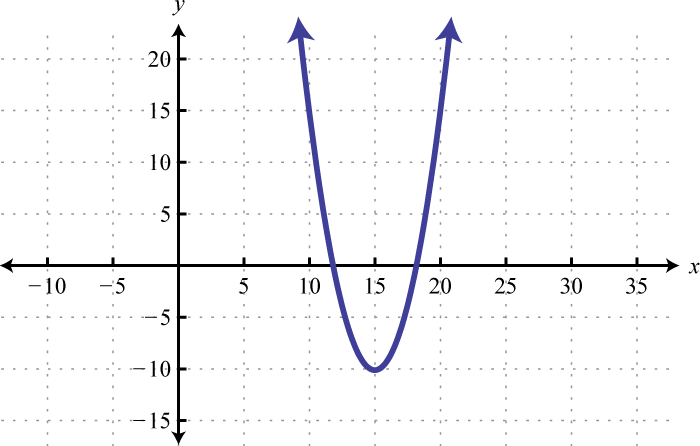
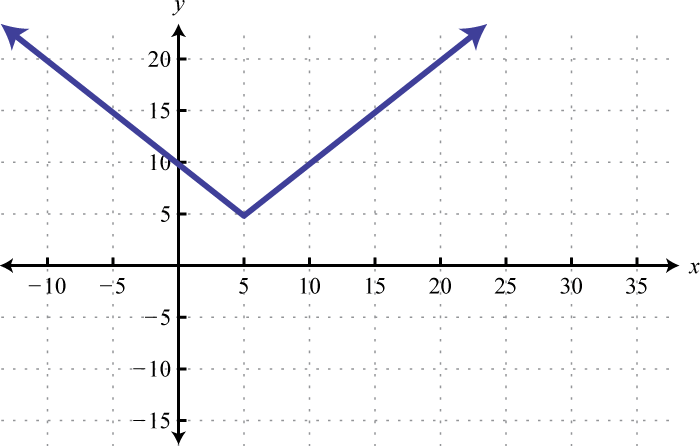
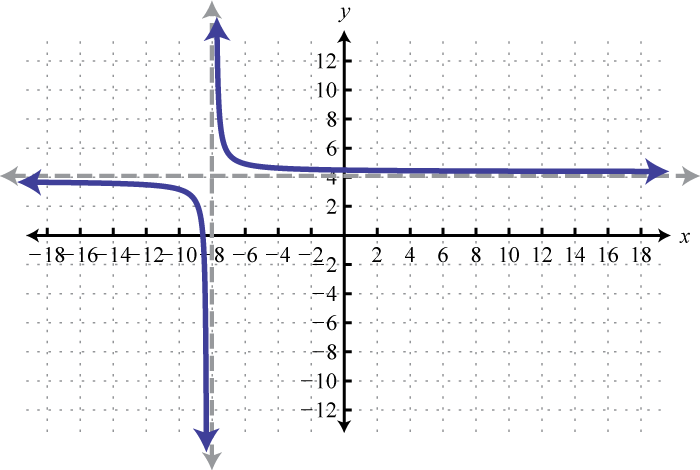
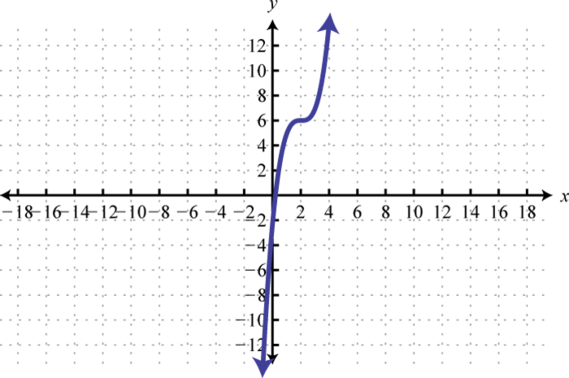
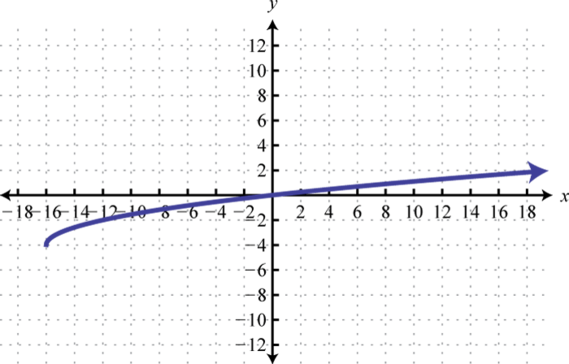
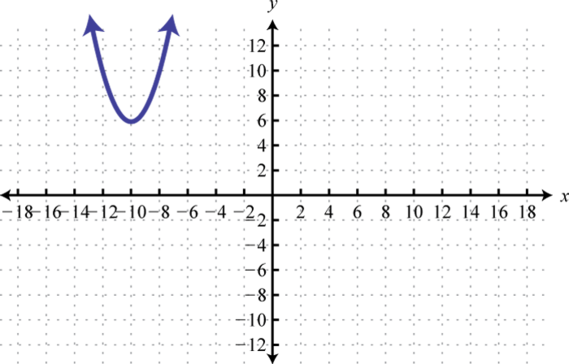
Match the graph the given function definition.
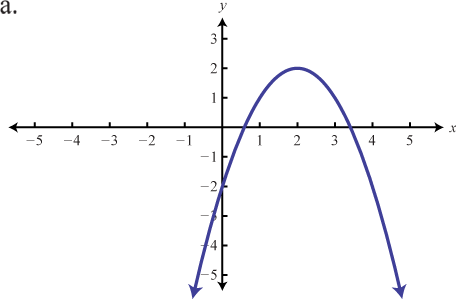
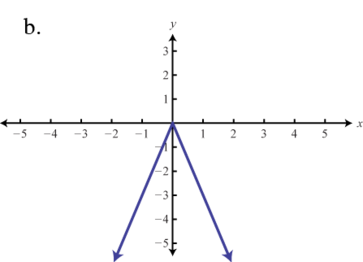
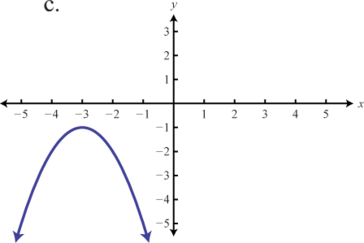
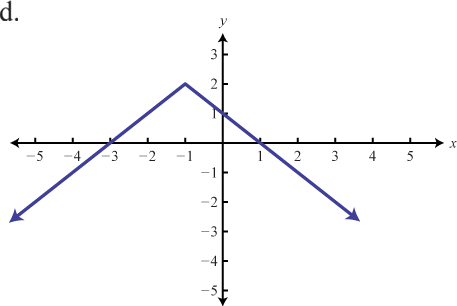
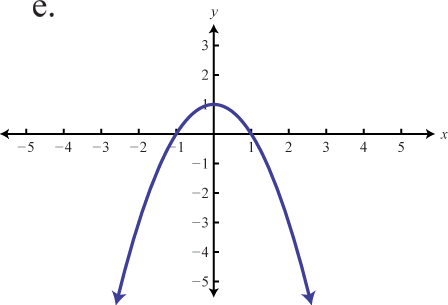
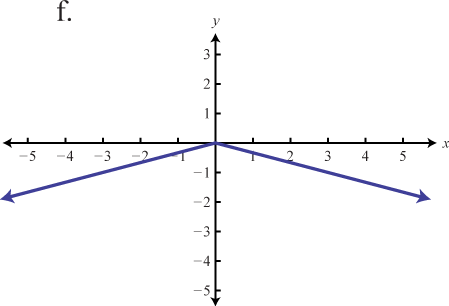
Use the transformations to graph the following functions.
Use different colors to graph the family of graphs defined by , where What happens to the graph when the denominator of k is very large? Share your findings on the discussion board.
Graph and on the same set of coordinate axes. What does the general shape look like? Try to find a single equation that describes the shape. Share your findings.
Explore what happens to the graph of a function when the domain values are multiplied by a factor a before the function is applied, Develop some rules for this situation and share them on the discussion board.
e
d
f
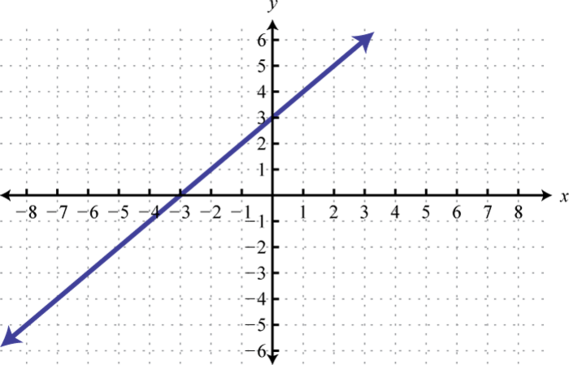
; Shift up 3 units; domain: ; range:
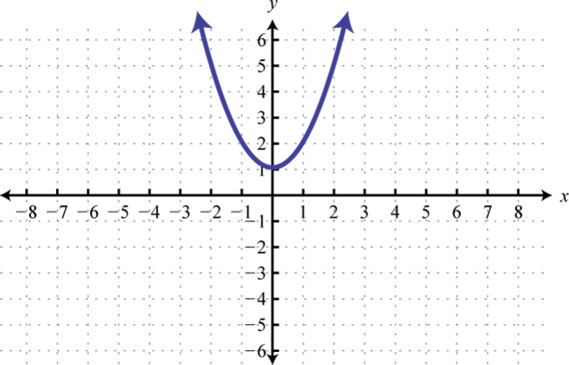
; Shift up 1 unit; domain: ; range:
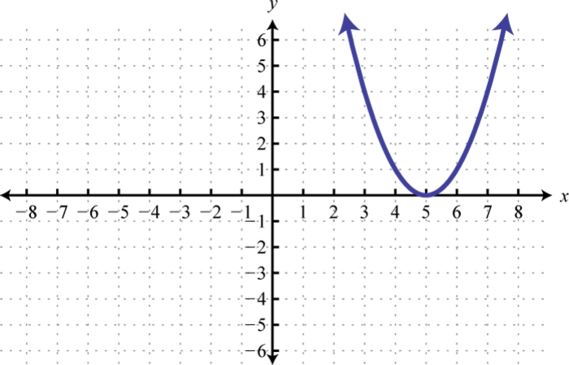
; Shift right 5 units; domain: ; range:
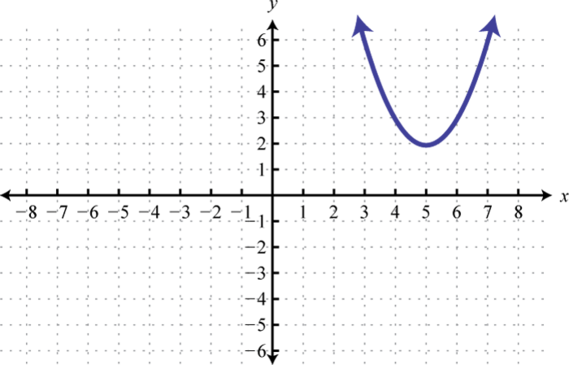
; Shift right 5 units and up 2 units; domain: ; range:
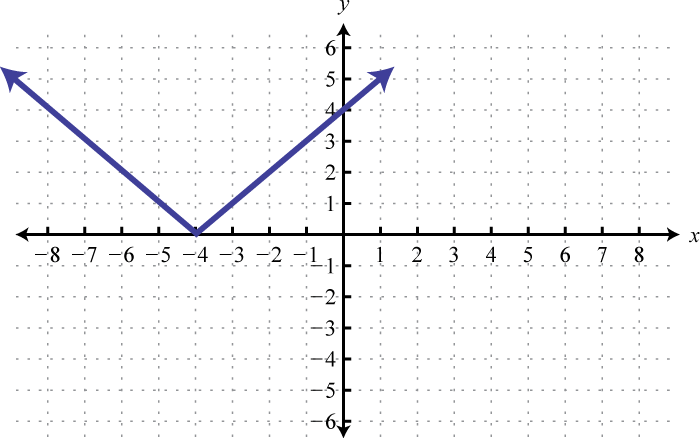
; Shift left 4 units; domain: ; range:
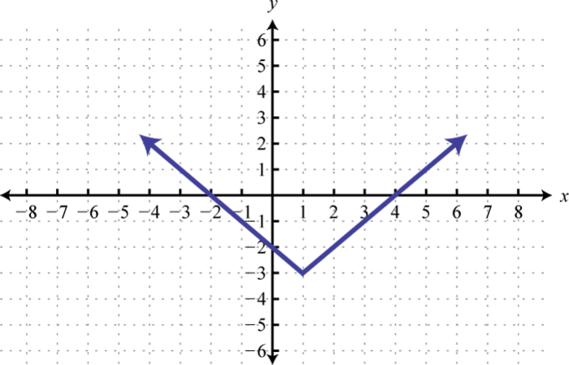
; Shift right 1 unit and down 3 units; domain: ; range:
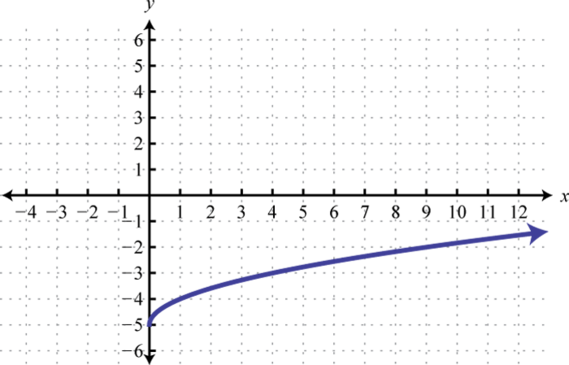
; Shift down 5 units; domain: ; range:
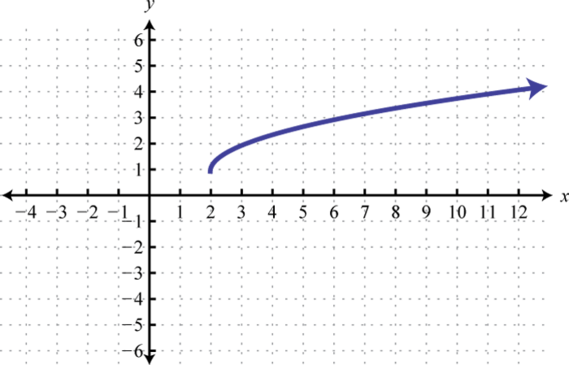
; Shift right 2 units and up 1 unit; domain: ; range:
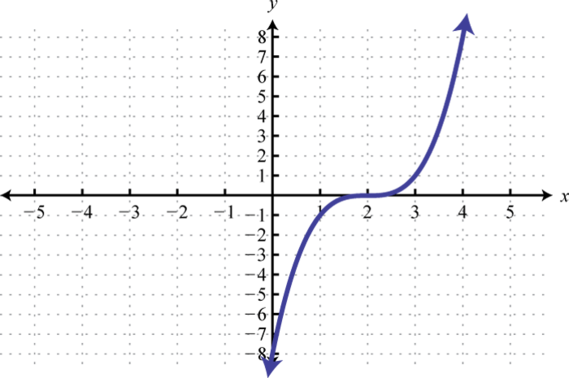
; Shift right 2 units; domain: ; range:
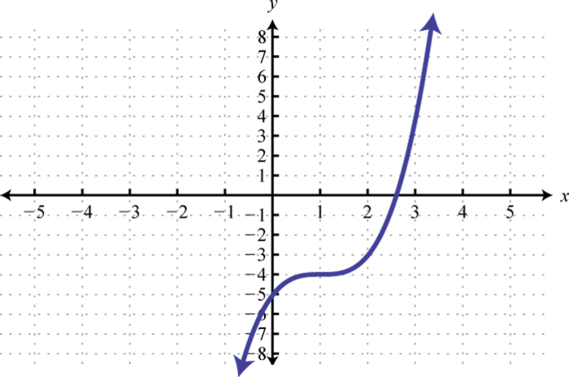
; Shift right 1 unit and down 4 units; domain: ; range:
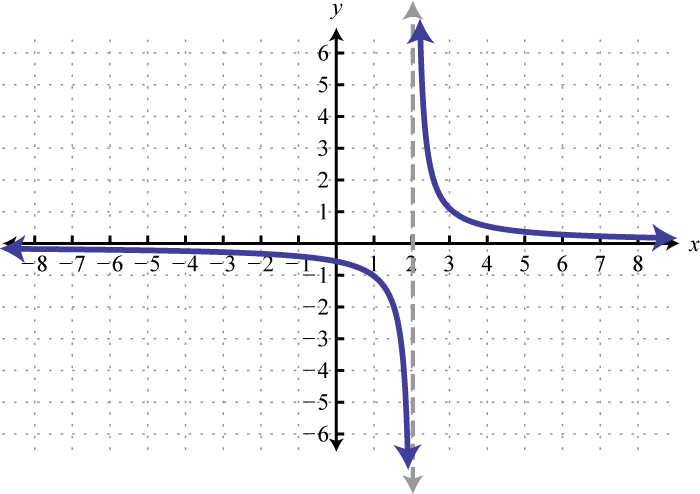
; Shift right 2 units; domain: ; range:
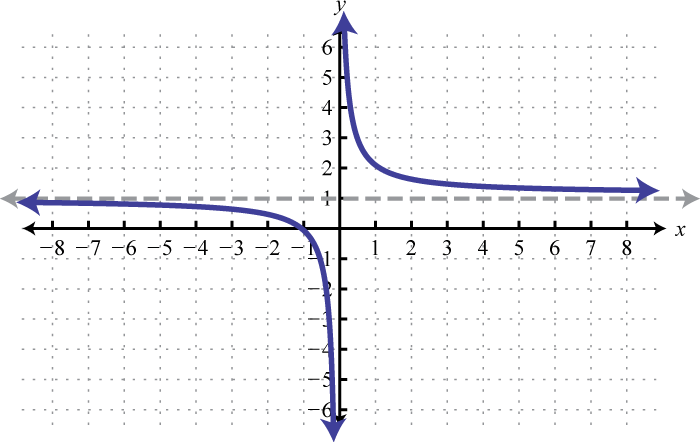
; Shift up 5 units; domain: ; range:
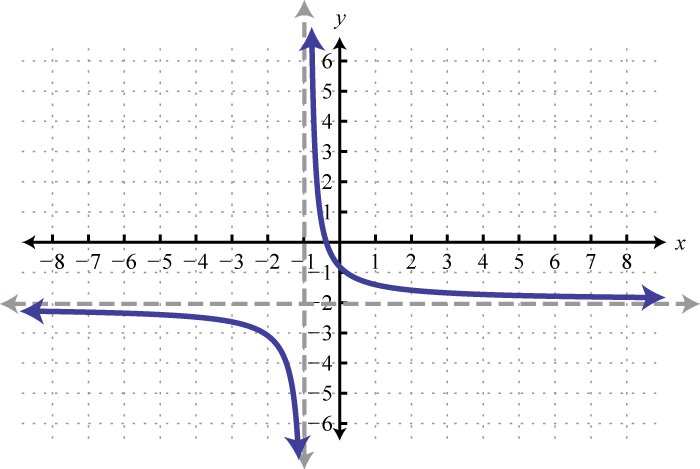
; Shift left 1 unit and down 2 units; domain: ; range:
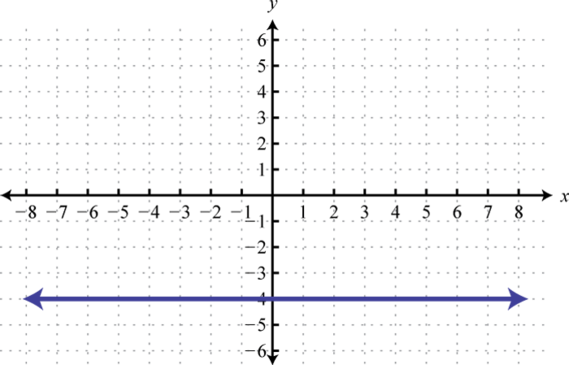
Basic graph ; domain: ; range: {−4}
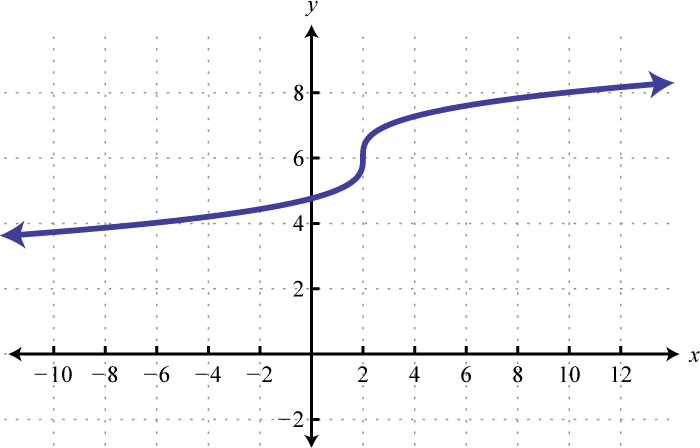
; Shift up 6 units and right 2 units; domain: ; range:
b
d
f
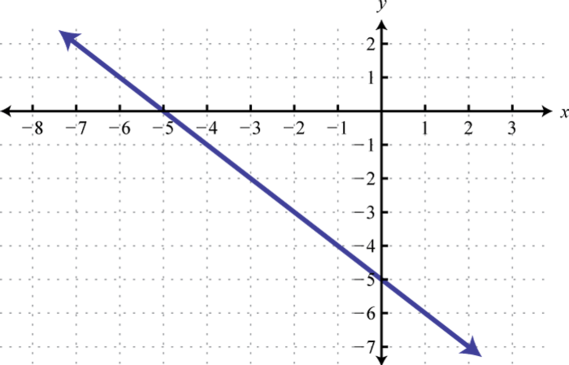
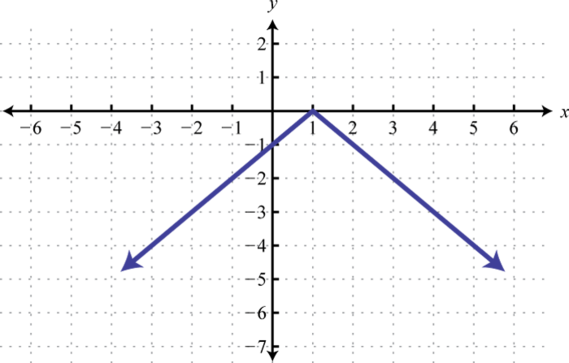
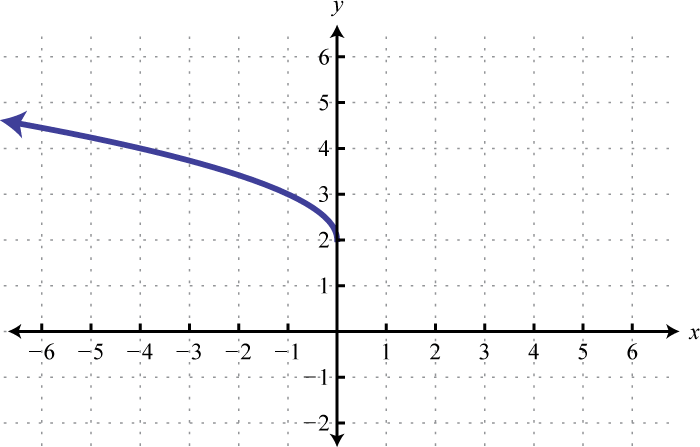
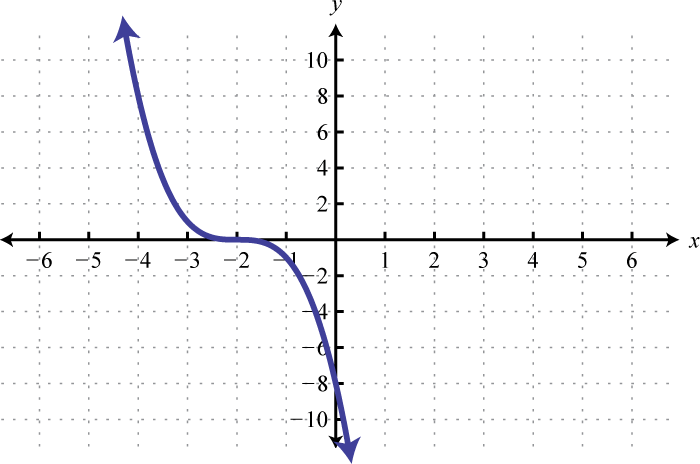
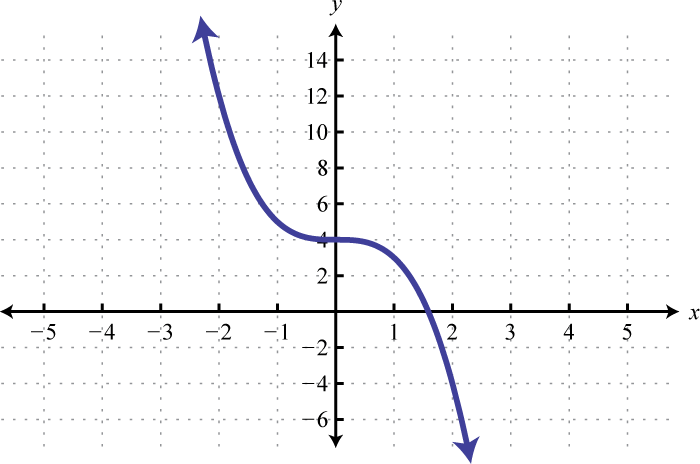
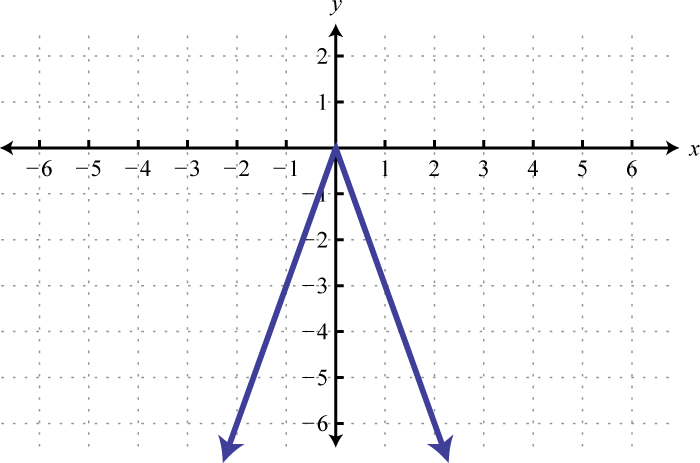
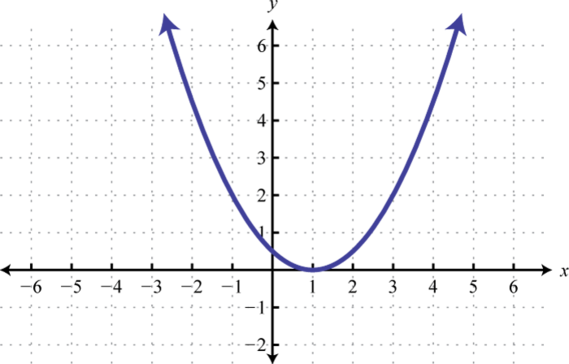
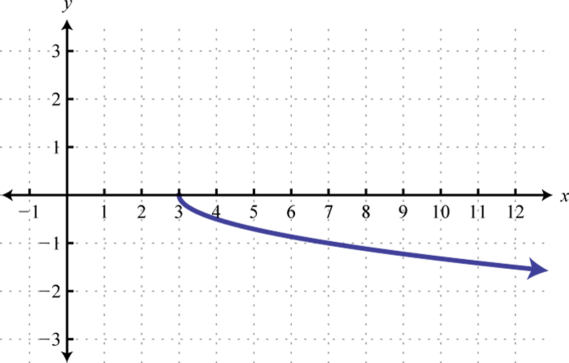
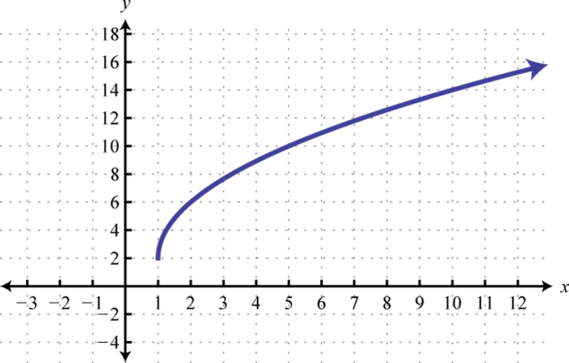
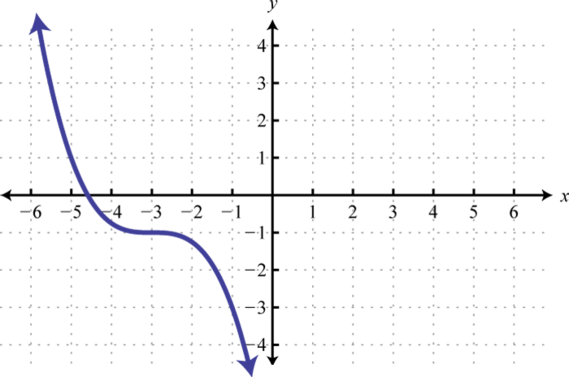
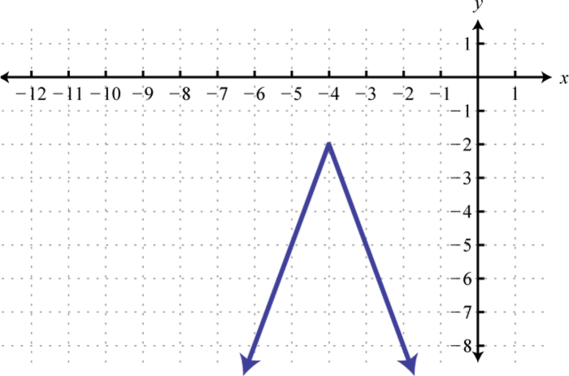
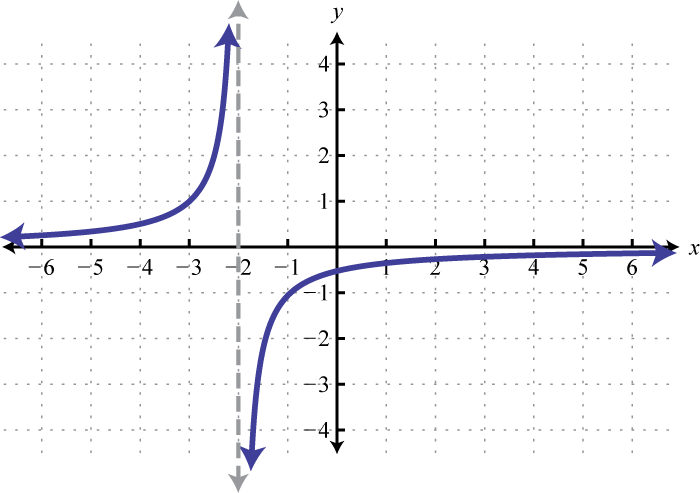
Answer may vary
Answer may vary