7 concepts
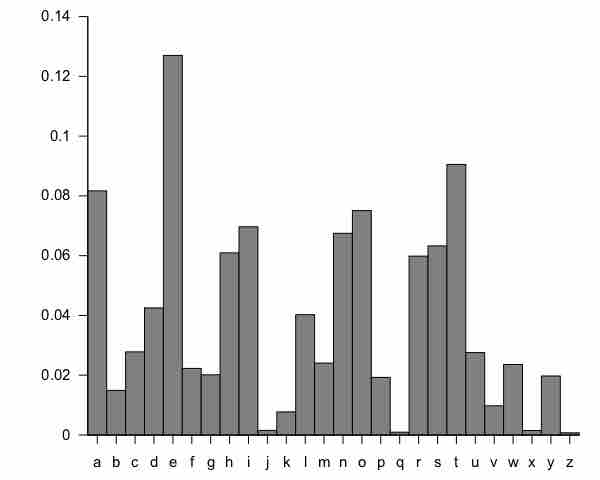
Guidelines for Plotting Frequency Distributions
The frequency distribution of events is the number of times each event occurred in an experiment or study.
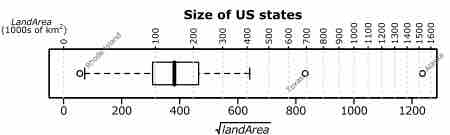
Outliers
In statistics, an outlier is an observation that is numerically distant from the rest of the data.
Relative Frequency Distributions
A relative frequency is the fraction or proportion of times a value occurs in a data set.
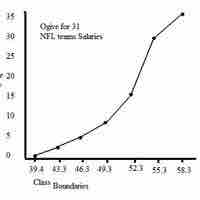
Cumulative Frequency Distributions
A cumulative frequency distribution displays a running total of all the preceding frequencies in a frequency distribution.
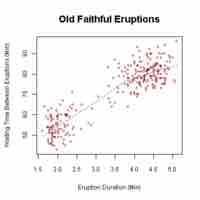
Graphs for Quantitative Data
A plot is a graphical technique for representing a data set, usually as a graph showing the relationship between two or more variables.
Typical Shapes
Distributions can be symmetrical or asymmetrical depending on how the data falls.
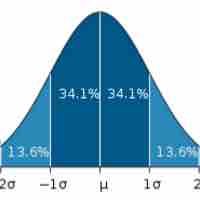
Z-Scores and Location in a Distribution
A