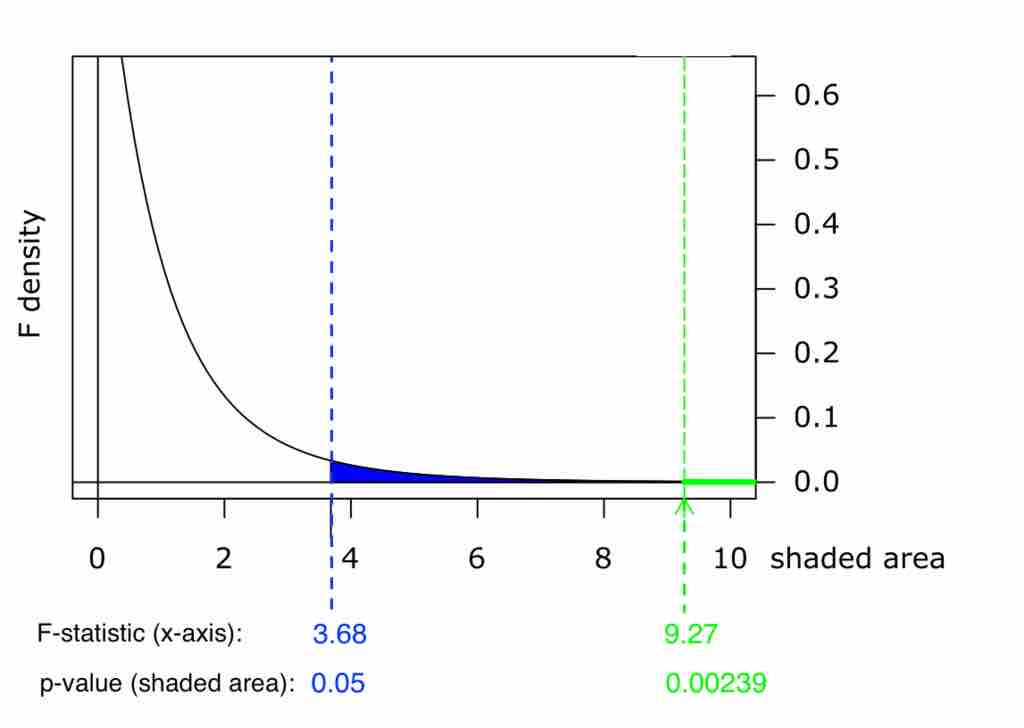
Graph of $p$ -Value
This chart shows example p-values for two F-statistics: p = 0.05 for F = 3.68, and p = 0.00239 for F = 9.27. These numbers are evidence of the skewness of the F-curve to the right; a much higher F-value corresponds to an only slightly smaller p-value.
Source
Boundless vets and curates high-quality, openly licensed content from around the Internet. This particular resource used the following sources:
"F-dens-2-15df.svg.png."
https://commons.wikimedia.org/wiki/File:F-dens-2-15df.svg
Wikimedia
CC BY-SA 3.0.