Oxygen saturation curve
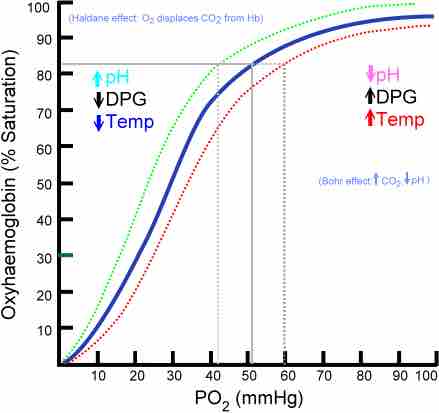
Due to cooperative binding, the oxygen saturation curve is S-shaped.
This line graph shows PO2 on the X-axis and oxyhemoglobin on the Y access. The lines indicate that the oxygen saturation curve is S-shaped as a result of the cooperative binding process described in the previous paragraph.
Source
Boundless vets and curates high-quality, openly licensed content from around the Internet. This particular resource used the following sources: