Discounting Curves
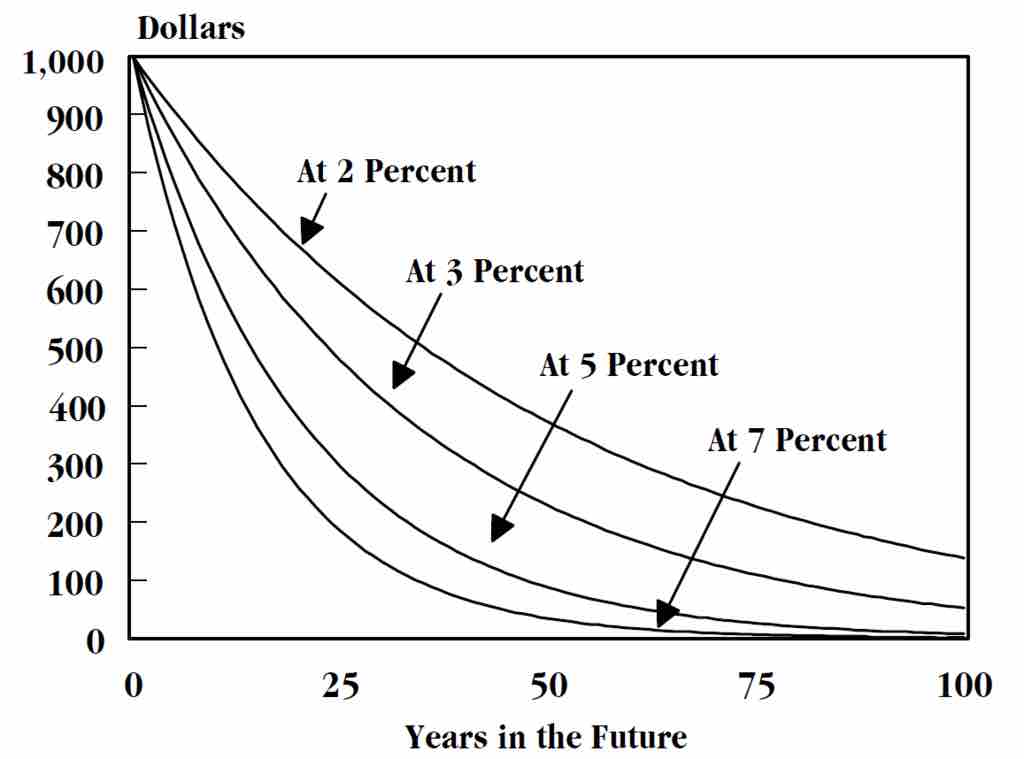
This chart illustrates the devaluation of capital over time as a result of various discount rates.
This chart illustrates the devaluation of capital over time as a result of various discount rates.
Source
Boundless vets and curates high-quality, openly licensed content from around the Internet. This particular resource used the following sources:
"Economics_of_climate_change_chapter3_discounting_curves.png."
https://upload.wikimedia.org/wikipedia/commons/9/99/Economics_of_climate_change_chapter3_discounting_curves.png
Wikimedia
CC BY-SA 3.0.