Monopolistic Competition
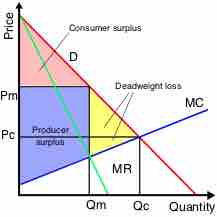
As you can see from this chart, the demand curve (marked in red) slopes downward, signifying elastic demand.
Source
Boundless vets and curates high-quality, openly licensed content from around the Internet. This particular resource used the following sources:
"Monopoly-surpluses."
http://commons.wikimedia.org/wiki/File:Monopoly-surpluses.svg
Wikimedia
GNU FDL.