Service-Goods Continuum
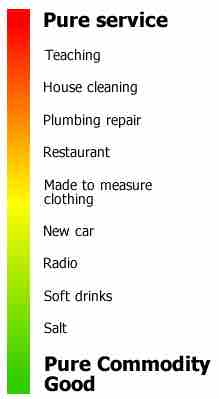
This simple line graph shows industries that are nearly 100% service-related at the top and industries that are nearly 100% product-related at the bottom. It is an illustration of how the service-product continuum is more of a spectrum than a black and white rule.
This image is a simple line graph, showing at the top industries which are nearly 100% service-related and at the bottom industries which are nearly 100% product-related. It is an illustration of how the service-product continuum is more of a spectrum than a black and white rule.
Source
Boundless vets and curates high-quality, openly licensed content from around the Internet. This particular resource used the following sources:
"Service-goods_continuum.png."
https://upload.wikimedia.org/wikipedia/commons/9/9c/Service-goods_continuum.png
Wikipedia
CC BY-SA 3.0.