Independent and Dependent Variables in Function Notation
Functions have an independent variable and a dependent variable. When we look at a function such as
We say that
Graphing Functions
Example 1: Let's start with a simple linear function:
Start by graphing as if
We choose a few values for the independent variable,
Next, substitute these values into the function for
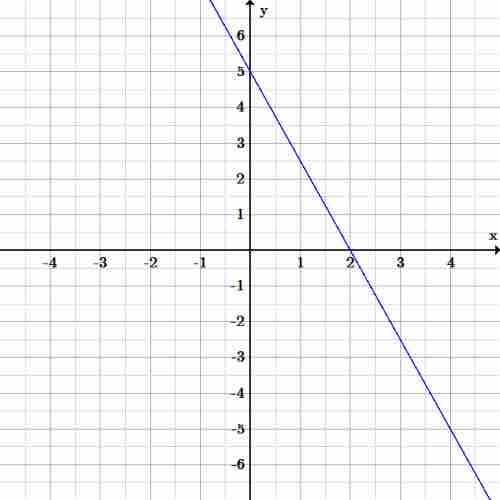
This function is that of a line, since the highest exponent in the function is a

Line graph
This is the graph of the function
Example 2: Graph the function:
Start by choosing values for the independent variable,
Next, plug these values into the function,
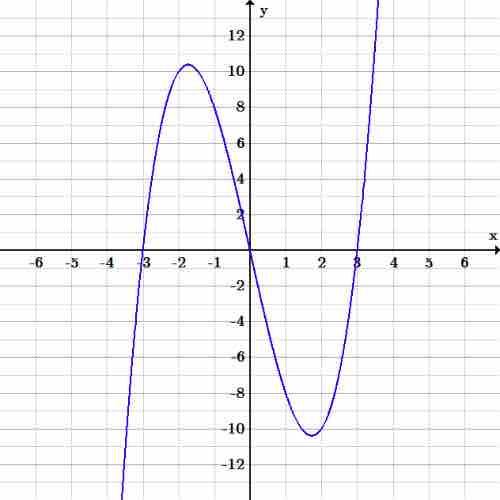
Next place these points on the graph, and connect them as best as possible with a curve. The graph for this function is below.

Cubic graph
Graph of the cubic function