Domain and range graph
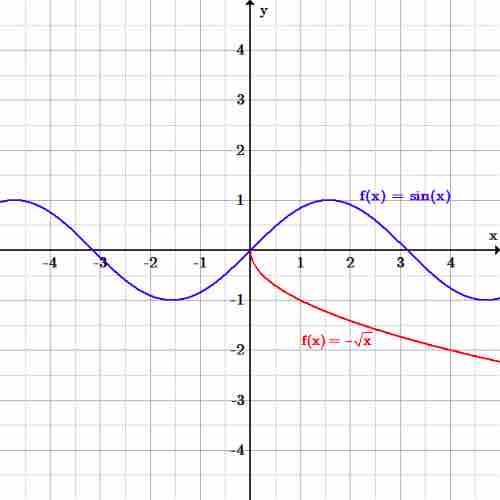
The blue graph is the trigonometric function
Source
Boundless vets and curates high-quality, openly licensed content from around the Internet. This particular resource used the following sources:
The blue graph is the trigonometric function
Boundless vets and curates high-quality, openly licensed content from around the Internet. This particular resource used the following sources: